In addition, animals and people being dependent on one another for their well-being, their well-being is also dependent on the health of the environment, and the frameworks of One Health and One Welfare can help us to understand the interconnectedness between the realms of the health and welfare of animals, people, and the environment.
This section introduces these frameworks and their utility in understanding and addressing the “inextricable and mutually reinforcing connections between problems” amongst these three realms [11]. The two different yet complimentary concepts of One Health and One Welfare were developed to help different disciplines work together to advance solutions to common threats to the interconnected health and well-being of humans, animals and their various environments which are mutually beneficial and ensure that improvements in any one realm are not achieved at the expense of another.
Figure 21: Visualizing the concept of One Health [12]
WHAT IS ONE HEALTH?
The World Health Organization (WHO) defines One Health as an approach to designing and implementing programmes, polices and legislation and research in which multiple sectors (human health, animal health and the environment) communicate and work together to achieve better public health outcomes.
The aim of the One Health approach according to the One Health Global Network is “to improve health and wellbeing through the prevention of risks and the mitigation of effects of crises that originate at the interface between humans, animals, and their various environments [13].”
Originating to better tackle zoonotic diseases (diseases that transfer between animals and humans), One Health has since evolved its focus beyond communicable disease to include any issue that affect health outcomes (e.g. urbanization, climate change, land use, demographic changes). Taking a One Health approach will therefore seek to understand and consider the inextricable links between human, animal, and environmental health and to achieve sustainable change and optimal health in any of these areas [12].
One Health Case Study
Building veterinary paraprofessional competencies through Animal Health Mentoring Framework
Across Africa and Asia large proportion of primary animal healthcare is delivered by veterinary paraprofessionals (VPPs). However, VPPs receive varying level of training and their profession is unregulated. Their training can range from 2 weeks to 2 years and is often lecture-based (which does not teach practical skills).
As a result, we see Paravets with low confidence and competence. This leads to poor handling, low clinical skills, inappropriate treatment choice (the inappropriate use of antimicrobials), spread of disease and incorrect diagnosis. This in turn contributes to Antimicrobial Resistance (AMR) and poses a risk to the health of humans and animals alike, as well as a threat to the environment (contamination of water or soil).
Brooke has developed the Animal Health Mentoring Framework (AHMF) whereby trained mentors (usually an experienced vet or Paravets) accompany VPPs while they are attending to real life cases, providing support, and coaching as the work is carried out. This allows VPPs to develop practical skills and allows for assessment on gaps and to identify priority areas for improvement.
Improvements in VPP training and regulation are critical to OH. Well trained paraprofessional improves food safety, help reduce AMR and prevent diseases transferring from animals to humans (zoonosis). It is important to note that the AHMF applies to all species of livestock, not just equines, and as such can be easily adopted by other organizations.
Since 2013, the AHMF has been successfully used to mentor over 4,000 animal health professionals in India, Pakistan, Kenya, Senegal, Ethiopia, Afghanistan, and Nepal. As a result of the mentoring, 37% of practitioners moved from an unsatisfactory competency level to satisfactory within one year.
WHAT IS ONE WELFARE?
One Welfare is a complementary approach akin to One Health, with One Welfare similarly recognizing the interconnections between animal welfare, human wellbeing and the environment and seeks to promote multi (cross sectoral) collaborations to better optimize desired welfare/well-being benefits for animals, people, and the environment [12].
The difference in the two concepts is primarily related to their origins and fields of application, with historically One Health focused more on disease prevention and treatment within the human health sector. One welfare simply promotes a slightly broader, more all-encompassing understanding of welfare inclusive of the welfare of animals as well as people and the environment. However, as the World Health Organizations defines health as “a state of complete physical, mental and social well-being and not merely the absence of disease or infirmity” One Health and One Welfare are in fact mutually inclusive given the inclusion of physical, mental, and social well-being in the definition of health. However, whereas One Health is a more established and evidenced approach in practice that is championed by leading international organizations, One Welfare is a newer concept whose practical applications for tackling the common threats to human, animal and environmental welfare are still being explored and evidenced.
3.2 Relevance of One Health and One Welfare to Working with Communities to Improve Animal Welfare
The advantage of using a One Health/One Welfare approach when working with communities to improve animal welfare, especially in communities where animal welfare may not be a priority issue considering human and environmental issues they may be facing, is that these approaches are more likely to result in solutions that create benefits that are of interest to all, which can generate greater buy-in and motivation to change amongst communities.
The OH/OW frameworks can help explore the inter-relationships between humans, animals, and the environment realms in the following three ways:
Understanding Causal Relationships between Realms: OH/OW frameworks can help to understand how the situation or issues affecting the health and well-being of any one realm may be causing the health and well-being issues in another realm (e.g. lack of regulation of glyphosate-based herbicide use in the agricultural sector negatively impacts the health of humans and animals) [14].
Understanding/Identifying Root Causes of Issues within and Between Realms: help to understand the relationships between human, animal and/or environmental health and wellbeing in terms of shared or interlinked root causes. This may be in terms of how root causes of issues impacting health and well-being within any one realm originate from one of the other realms, as well as how issues in human, animal and environmental health and wellbeing may share root causes e.g. lack of knowledge of antibiotics and understanding of antimicrobial resistance causes their misuse and overuse which make infections harder to treat and increases the spread of disease in humans and animals [15, 16].
Shared External Threats or Risks: they can help to understand potential threats or risks to health and welfare shared by humans, animals, and the environment e.g. climate change.
Prior to developing solutions to animal welfare issues, it is helpful to first consider potential linkages between the health and well-being of animals, people, and the environment in terms of the above, and seek multidisciplinary collaborations that can better inform this understanding and support implementation of solutions which can better optimize benefits for all whenever feasible.
One Welfare | Case Study 1 Brick Kilns
In South Asia building material for the growing megacities is produced in around 152,700 active brick kilns. These kilns employ over 16 million people and 500,000 animals, mainly horses, donkeys, and mules, and produce 86% of the world’s bricks.
Workers in the kilns must endure extreme heat, dusty and polluted air, tough terrains, long hours, and hard physical labour. Many of them are women and children. In the brick kilns we have surveyed, 60% of workers lived below the poverty line, 80% had no running water and 60% had no latrine facilities. Restricted access to healthcare results in high rates of self-medication or use of unqualified doctors. Mental health is affected with 80% workers in one kiln reporting lack of pride in their work and 60% feeling no control over their lives.
Equines carry heavy loads in extreme heat, with limited access to water, food, shade, and rest. Common health issues in animals working in the kilns are hoof problems (50%), wounds (30%), abnormal gait (52%) and fear of human interaction (30%). Brick kilns are a huge contributor to pollution across the continent. According to the World Bank, the brickmaking sector is responsible for up to 91% of total particulate matter emissions (solid airborne particles) in some South Asian cities.
It was with a One Health solution in mind that Brooke has formed a coalition of organisations dedicated to improving labour conditions, animal health and welfare, child labour, and quality of the natural environment in brick kilns across South Asia: the International Labour Organisation (ILO), the South Asia Initiative to End Violence Against Children (SAIEVAC), the Donkey Sanctuary, the International Centre for Integrated Mountain Development (ICIMOD), World Wildlife Fund (WWF), ActionAid Nepal, International Union For Conservation of Nature (IUCN) and Global Fairness Initiative.
One of the interventions led by a coalition partner is the ‘Green Bricks’ initiative, which is tackling harmful kiln emissions through the implementation of new ‘clean air’ technology. ICIMOD is working with the Climate and Clean Air Coalition (CCAC) in South Asia to train brick entrepreneurs and raise awareness of new, increasingly cost effective and scalable, kiln technologies and improvements in the brick production process. One of these technologies, called zigzag, reduces coal consumption by 20% and produces up to 70% lower levels of pollution than the existing technology. Other interventions have included the introduction of human and animal first aid kits into kilns, health, and safety training, linking workers to social care and health care schemes.
One Welfare | Case Study 2 Equine welfare in the production of organic cocoa in Nicaragua
In the north side of Nicaragua, the grass-root organization ADDAC (Association for Diversification and Development of Agricultural Communities) leader in agro-ecological activities and located in Waslala, is implementing a local project to increase the access of 1,000 organic cocoa producers to fair trade markets.
This region is recognized since 1961 for its contribution of 50% of the national cocoa bean production, and almost 70% of organic cocoa production is concentrated in areas with deficient road access. The families that depend on this crop to meet their basic needs, traditionally rest on equines for key tasks of the stages of production, harvesting, primary transformation (fermented and dried) and commercialization of cocoa beans. Horses and mules participate in the preparation of the soil for sowing and fertilization, the transfer and transplantation of genetic varieties, irrigation, surveillance activities for the maintenance, health and rehabilitation of cocoa plantations, and forest regeneration. They also represent the unique means of transportation of the cocoa fruits to be transformed and placed for domestic consumption and export markets. Moreover, working equids provide raw material to produce organic fertilizer to contribute to good soil conditions for cocoa growth, and the use of animal traction, lessens the pressure on carbon emissions, which add to environmental sustainability.
Through the experience of ADDAC, in collaboration with Brooke, this organization was introduced for the first time to the Equine Welfare, and has reflected on the link between the three realms of welfare: from the perspective of cocoa producers´ wellbeing, by improving the welfare of their equids, they perceived benefits to household’s incomes since the transportation of the cocoa grains on time to crops collection centre, encourage engagement through negotiations among merchants, and families are able to cope their prioritized needs. Additionally, the dynamics of cocoa-producing families are influenced by their equines as they converge in negotiation or trade centres, fairs, and traditional events, where the bonds between people and community roots and attachment is strengthened.
These has also benefited equines since cocoa producer are more aware of equines needs and have adopted positive animal welfare practices such as: the use of proportionate loads, appropriate hooves’ care, better feeding, preventive veterinary care; the appropriate use of the equid´s services in the post-harvest activities, and the reduction of the loss of production caused by accidents suffered by working equids in poor condition. These practices have helped families to report savings of approximately $1,645 per household per year that can be invested in improvements of the quality of the cocoa production, equid welfare. In addition, cocoa qualifies for commercial certifications to acquire a better market price, which represents USD 0.45 more per sold kilogram.
In their accumulated experience, ADDAC express that they have reached a more comprehensive understanding of the agro-ecological approach under the One Welfare Umbrella, which extends beyond the use of agricultural technology for the restoration of the productive capacity of the soils, but refers to the demand of the farmer production model, involving aspects of community organization and participation, capacity for commercialization and rescue of values for the management of the environmental and animal welfare, since there is a relationship of coexistence and co-dependency.
“Animal welfare leads communities to explore the One Welfare and One Health approach, strengthening the conceptual and practical framework of work, and ADDAC to better understands the relationship between animal welfare, productivity, the environment and human development.”
Luis Rosales, Animal Welfare Technician, ADDAC
3.3 Key Considerations for Using a One Health or One Welfare Approach
Potential Benefits of Using OH/OW Approaches:
Promotes more holistic systems thinking which leads to more strategic and sustainable solutions. This can improve understanding and solutions for addressing root causes, exploring cause and effect relationships, or interdependencies that can have a spill over effect from one realm to another.
Can be a useful framework for tailoring communications in terms which speak to what stakeholders’ value and find relevant e.g. framing outreach messages to communities, donors, collaborators, or policy makers to ensure it speaks to their human or environment oriented interests rather being focused on animal welfare.
It can promote greater collaboration and interest in strategic partnerships by harnessing interest, expertise, and resources across sectors to address cross cutting issues resulting in greater efficiency in resource use and more sustainable solutions and benefits for all e.g. helps identify potential collaborators experienced in addressing human and environmental issues identified as root causes of animal welfare issues.
The One Health approach encourages a greater focus on prevention, which is justifiable due to being more cost effective, and can therefore be particularly appealing and make generating support amongst policy makers and leaders easier e.g. Using a OH approach can helps prevent pandemics like COVID 19 (Delia Grace, The business case of One Health – printed material.
Potential Limitations of Using OH/OW Approaches:
Designing every project as OH/OW project can limit the scope of issues addressed. While beneficial to utilize one health and one welfare frameworks when appropriate, projects should not feel beholden to using it, or require linkages to human or environmental health and welfare for every project. Animal welfare issues may not have linkages to human or environmental wellbeing, but that doesn’t make them any less important to address. It could potentially be more challenging to address them if communities or other stakeholders with whom you may wish to engage do not share the same animal welfare improvement priorities. In such cases, using the science of human behaviour change and best practices in participatory community engagement and development is recommended to inform project design and improve the effectiveness of implementation and attainment of desired results.
It can be challenging to collaborate and coordinate work across disciplines and different stakeholders e.g. identifying and establishing collaborations can be time consuming, there may be differences in ways of working or availability of resources that need to be resolved.
While these challenges should not be ignored, it is clear the potential benefits of collaborating in terms of the health and well-being of animals, people, and the environment, as well in terms shared resource investments in such projects, make them worthwhile when feasible.
A Venn diagram seeks to represent relationships between individuals, groups and/or other key actors or resources by representing them as “components” or “nodes”, and the associations between them as links or lines. Various attributes such as colour, size, distance between and other properties may be used to characterize different kinds of relationships. For example, Venn diagrams have the potential to visually represent the relative importance of different relationships or resources, the frequency of interaction between actors, and/or access to different actors or resources. For the purpose of animal welfare, the tool has been adapted to analyse relationships between animal owners, users and/or caregivers and animal-related resource and service providers, as well as assess the relationships between individuals, groups, and actors important to the lives of animal-owning communities and their animals. The process of visually mapping relationships can inform planning by enabling targeted strengthening and/or development of new relationships, for both the community and the organization.
Tool purpose:
Time needed:
• To identify animal-related resource and service providers animal-owning communities rely on most and their level of satisfaction with each one. • To identify the community’s preferred resource and service providers to build or strengthen their capacity, or improve relationships with those less preferred. • To identify gaps in service provision, which if addressed, could better meet the needs of animals and people. • The activity may be repeated to assess changes and improvements that have resulted from any activities implemented by communities and/or the facilitating organization.
1.5 - 2 hours per diagram
Materials needed:
Chart paper, coloured sticker dots and/or coloured markers, coloured index cards or sticky notes, large circular cut-out of different colours and sizes.
Keyword Search Tags
Project Phase: Initiation Phase, Planning Phase
Approaches for Working With Communities: Community Development Approach, Community Engagement Approach
Behavioural Drivers (COM-B): Behaviour Change Diagnosis and Planning
Project Support: Participatory Learning and Action Tools, Needs Assessment
Specific Topics: Animal Health and Services
Resource and service provider Venn diagram
This tool enables community members to identify all the animal-related resource and service providers on which they rely. Examples of resources include: water points, grazing land, fodder production or storage areas, grain grinders, animal shelters; while service providers may include: local animal health service providers, veterinarians, feed supply shops, working animals’ equipment shops and/or money lenders. This activity may build on information gathered in theT1 Mapping activity - related to the most important resources and services to the community - as it goes into more detail to understand usefulness, availability, frequency of use and satisfaction with each provider. Once identified, participants are able to analyze their relationships and usage of different resources and service providers, including their relative importance to the welfare of their working animals and people who depend on them.
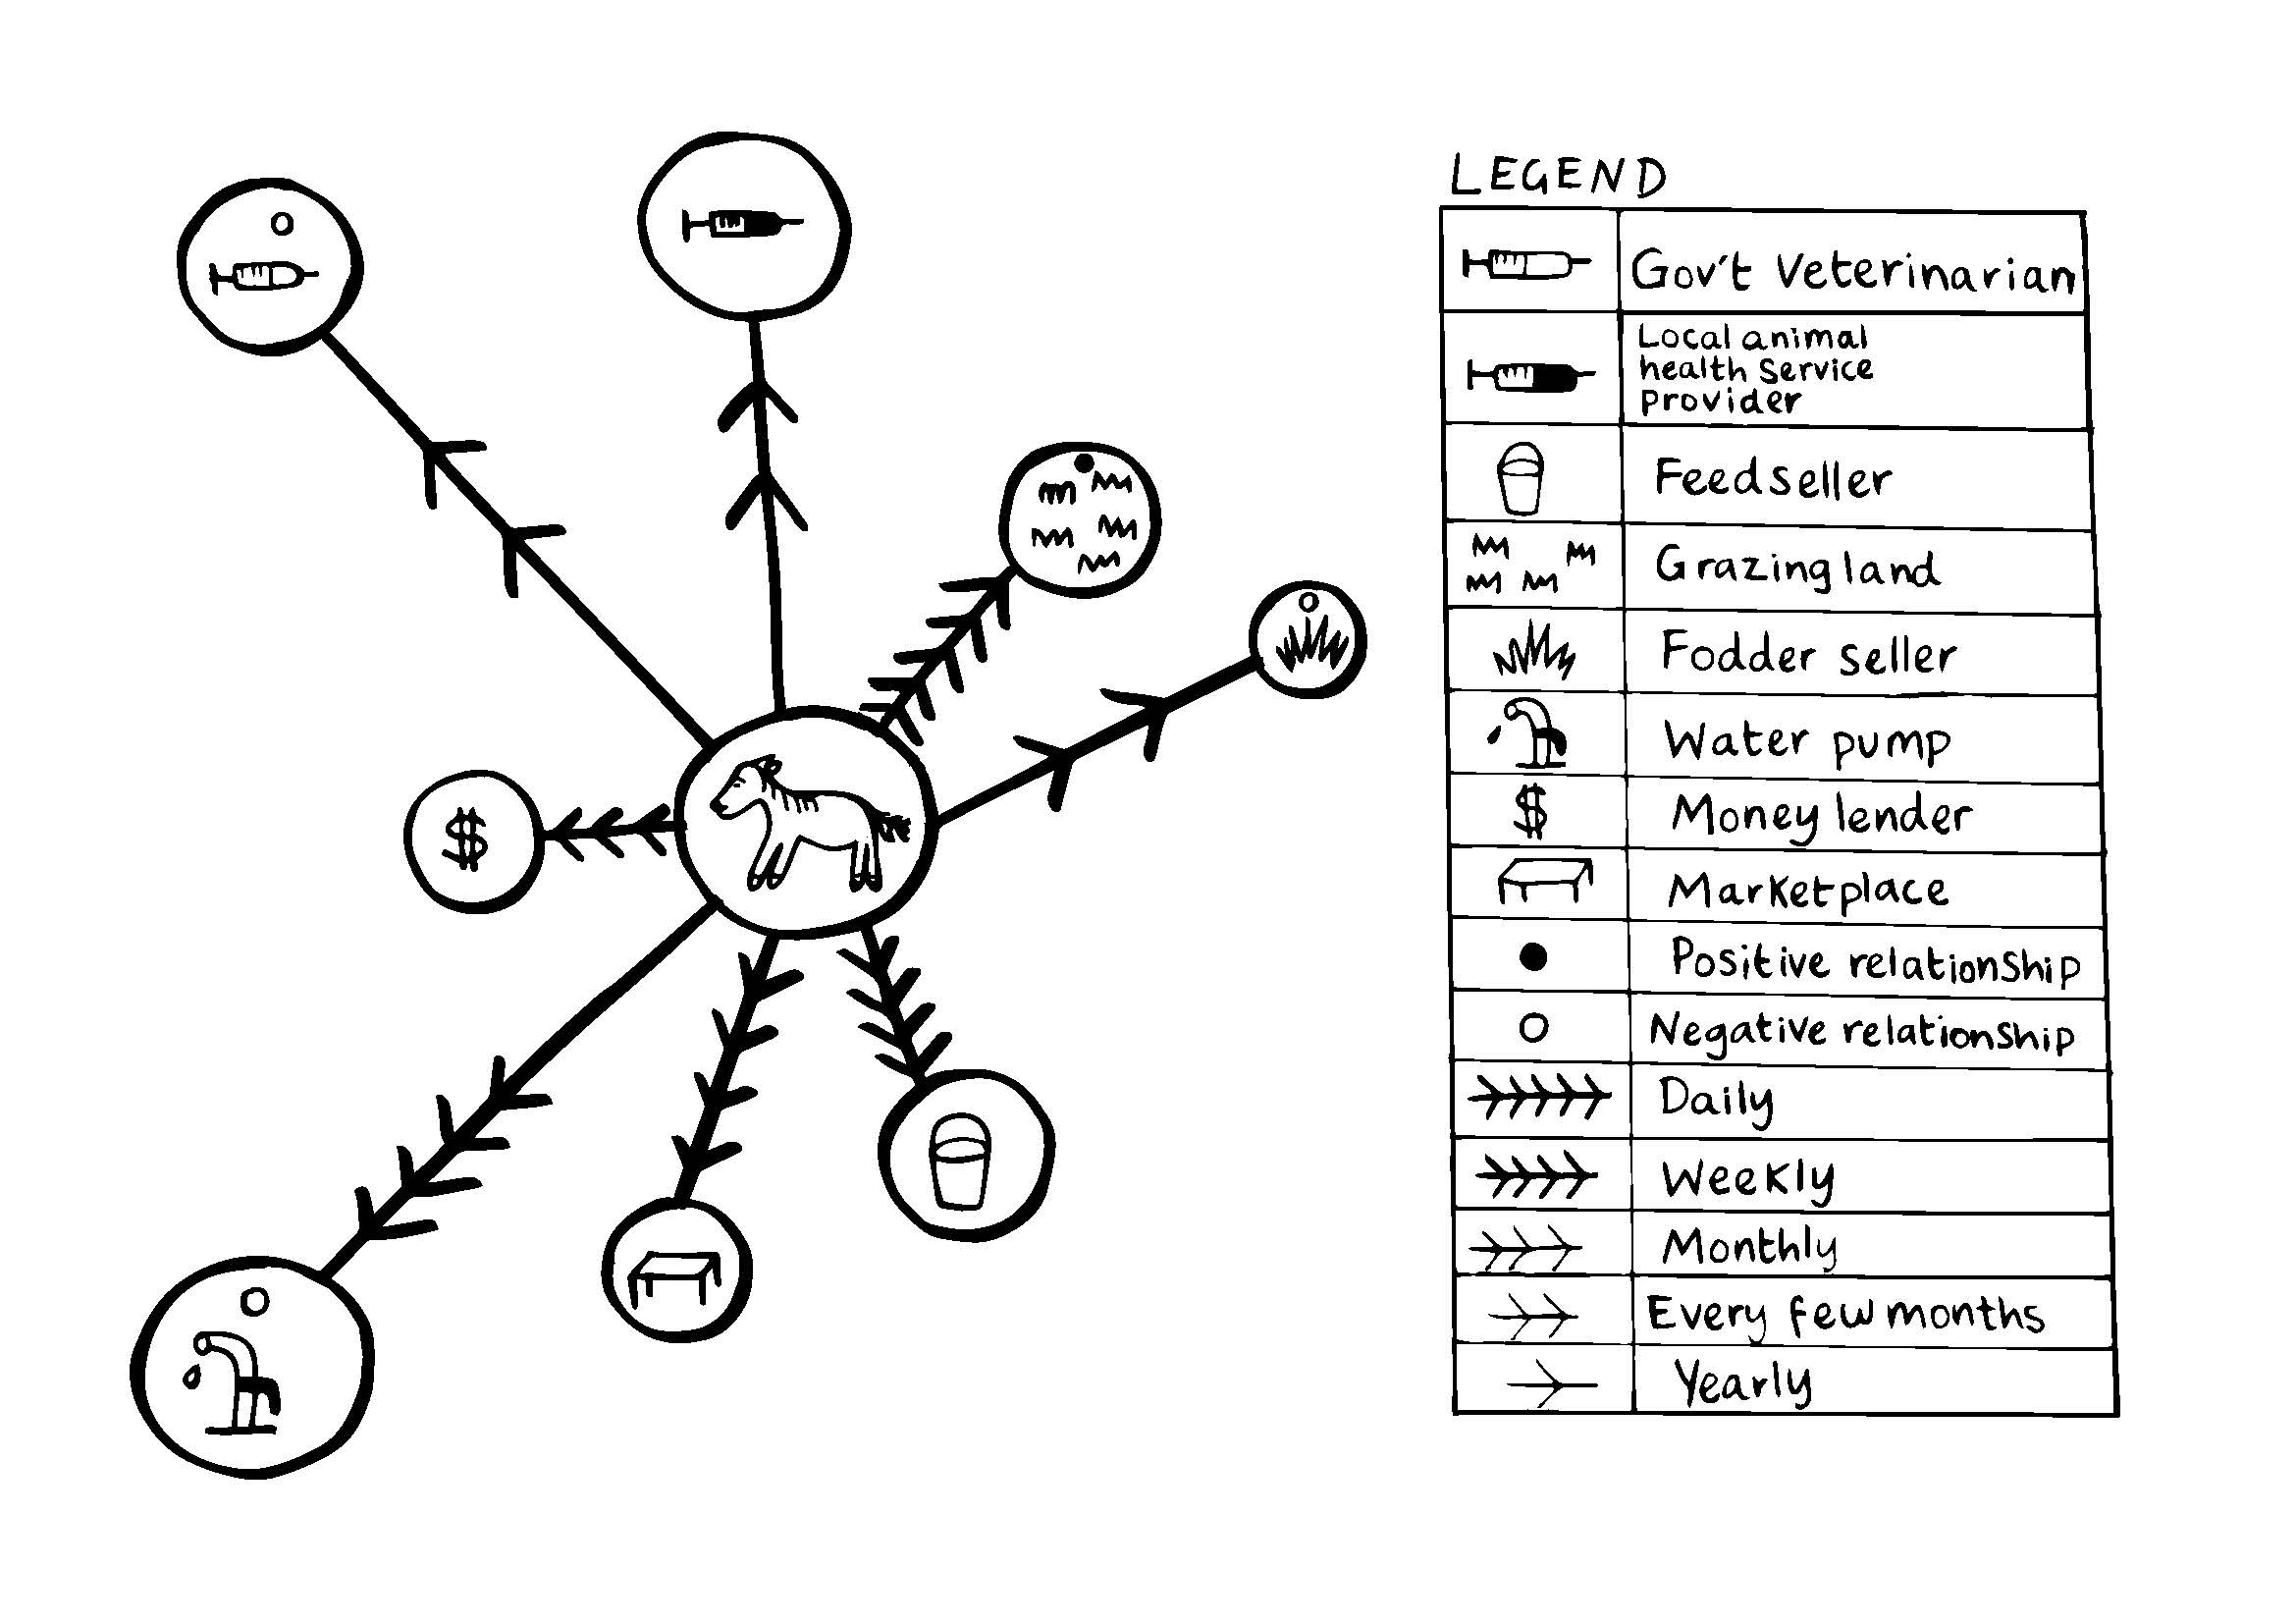
Figure T3A Venn diagram of a community’s animal-related resources and service providers
In the example above, members of an animal-owning community created Venn diagram to represent the animal-related resources and service providers they rely on. The size of the circles represent the perceived relative importance and usefulness. Distances from the centre represent availability and arrows represent frequency of use. Discussions highlighted the following important information:
The government veterinarian is shown in a large circle because this service provider is perceived to be useful, and was placed far from centre circle due to their poor responsiveness/availability, with infrequent use indicated by two arrows.
The local animal health service provider was felt to be more useful, represented by a slightly larger circle; however, their services are similarly used infrequently, despite their higher responsiveness/availability.
Participants indicated satisfaction with the local animal health service provider due to their lower relative cost despite recognizing they provide lower quality care.
They also indicated they were unsatisfied (red dot) with the government veterinarian due to their higher cost and low responsiveness, despite acknowledging that they provide higher quality service.
Discussions also highlighted that participants only call the local animal health service provider if animals get very sick, identifying an absence of preventative animal health practices amongst animal-owning households.
Resources and Service Provider Venn diagram
Step 1
Start by explaining the purpose of the exercise and then ask participants to identify the resource and service providers that are important to them in terms of usefulness to their animals. Ask them to start by first identify the MOST useful resources and service providers and represent them on the LARGEST size pre-cut circle of paper with words or symbols. Alternatively, they may use local materials and place them on top of the paper circles.
Continue identifying the next most important/useful resources and service providers using the next smallest sized circle and so on, until all resources and service providers have been identified with the biggest circles representing the most useful resources and service providers, and the smallest circles representing the least useful. There is often a lot of debate and discussion while categorizing the usefulness of different resources and service providers.
Step 2
Next ask participants to draw a picture representing their animals (or their community) in the centre and place the different sized circles representing resources and service providers around it. Then ask participants to move the resource/service provider circles closer or further away from the centre according to their availability e.g. enough resources or service provider responsiveness available when needed.
Please note circle placement from the centre may be adapted to represent another variable.
Step 3
Once all circles have been placed around the central circle, ask the ask the group to indicate which resources and service providers they use most frequently by drawing arrowheads on the lines between the centre circle and each resource or service provider.
In the example above, a scale of 5 arrows was used to represent the following frequency parameters: • 4 arrows: weekly • 3 arrows: monthly • 2 arrows: every few months • 1 arrow: yearly
Allow participants to define frequency parameters in a way that makes sense to them.
Step 4
Next, ask participants to discuss their level of satisfaction with the resources or service providers. Symbols or objects may be placed on each circle representing the resource or service provider to indicate or score participants’ satisfaction (e.g. happy/sad face ☺/☹, or green/red dot 🟢/🔴, seeds or beans). There is often a lot of interesting discussion and insights generated while participants discuss resources and service providers they are satisfied or dissatisfied with. Additional dimensions may also be added to this Venn diagram exercise by asking participants to use beans, seeds, or stones to represent other variables. For example, participants can score the cost or quality of an animal-related resource or health service providers.
Step 5
Once complete, encourage participants to discuss what the Venn diagram shows. Use the following questions to guide the discussion: • If not already discussed through during the creation of the diagram, it may be helpful to ask: Why some resources or service providers considered useful? Why are participants satisfied or unsatisfied with certain resources or service providers? Why are some resources or service providers relied on more frequently/infrequently? • Are there any resources or service providers missing from diagram which, if existed, could better help meet the needs of your animal? Why are they missing and why are they needed? • What changes in animal-related resources and service providers could better serve you and your animals? • What have you learned because of participating in this activity?
Step 6
The diagram should be documented through photos or recreated on paper. Copies should be made and distributed to the group for their records, future reference and/or action planning. Add a copy to your project action tracker and note preferred resource and service providers.
Facilitation Notes: Resource and service provider Venn diagram
It is useful to examine perceptions of animal-related resources and service providers with different groups in a community as they may rely on or have different perceptions of resources and service providers. Consider asking both men and women from animal-owning households to participate in this activity; or if it is not feasible or appropriate to conduct this activity with both sexes together, consider conducting this activity separately.
Facilitators should not control or insert their ideas into the diagram, but rather facilitate the process so that people design it themselves. Probing questions may be used to encourage people to think about the general categories of individuals, groups and actors to include.
Facilitators are encouraged to adapt the parameters and symbols as needed to investigate topics of interest and/or simplify the activity.
Try representing each resource and service provider on different pieces of paper, as it allows participants to move cards around throughout the discussion. However, the activity may also be drawn directly on the ground using chalk, sticks or stones as needed.
If using paper circles, it is helpful to cut out a selection of different sizes ahead of time. Consider preparing at least 5 different sizes of circles to enable the relative importance of all identified resources and service providers to be effectively captured.
Next Steps
Information on resource and service provider gaps identified in the initiation phase may be useful for informing discussions during the community action planning phase.
Consider using T9 Matrix Ranking and Scoring to better understand the criteria informing animal-owning households’ preferences for different resources and/or service providers, explore their satisfaction/dissatisfaction in more detail and prioritize their preferences for community action planning.
Use preferred resource and service providers, identified dissatisfaction and gaps in use or knowledge to inform project planning.
T3b: Social Networking Venn diagram
The social network Venn diagram illustrates relationships between individuals, groups and/or other key actors or resources by representing them as “components” or “nodes”, and the associations between them as links or lines. Various attributes such as colour, size and distance between each may be used to characterize different types of relationships. For example, Venn diagrams have the potential to visually represent the relative importance of different relationships or resources, the frequency of interaction between actors, and/or access to different actors or resources. For the purpose of animal welfare, the tool has been adapted to analyse relationships between animal owners, users and/or carers and animal-related resource and service providers, as well as assess the relationships between individuals, groups, and actors important to the lives of animal-owning communities and their animals. The process of visually mapping relationships can inform planning by enabling targeted strengthening and/or development of new relationships, for both the community and the organization.
Tool purpose:
Time needed:
• To identify individuals, groups and key actors perceived to be important to households and their animals (positively or negatively). • To understand the relative importance of different actors. • To understand differences between men and women’s access to individuals, groups and key actors within their social network. • To inform planning by identifying social network gaps that, if addressed, could better meet the needs of animals and people. • This tool may be useful for identifying potential collaborators or partners already working in the community.
2 hours
Materials needed:
Chart paper or coloured dust, chalk, coloured sticker dots and/or coloured markers, coloured index cards or sticky notes, stones, sticks, seeds or beans.
Keyword Search Tags
Project Phase: Initiation Phase, Planning Phase
Approaches for Working With Communities: Community Development Approach, Community Engagement Approach, Societal Outreach and Campaigns Approach
Behavioural Drivers (COM-B): Behaviour Change Diagnosis and Planning, Opportunity
The social network Venn diagram can be used to analyse social networks within a community. The household or community could be the focal point for analysis.
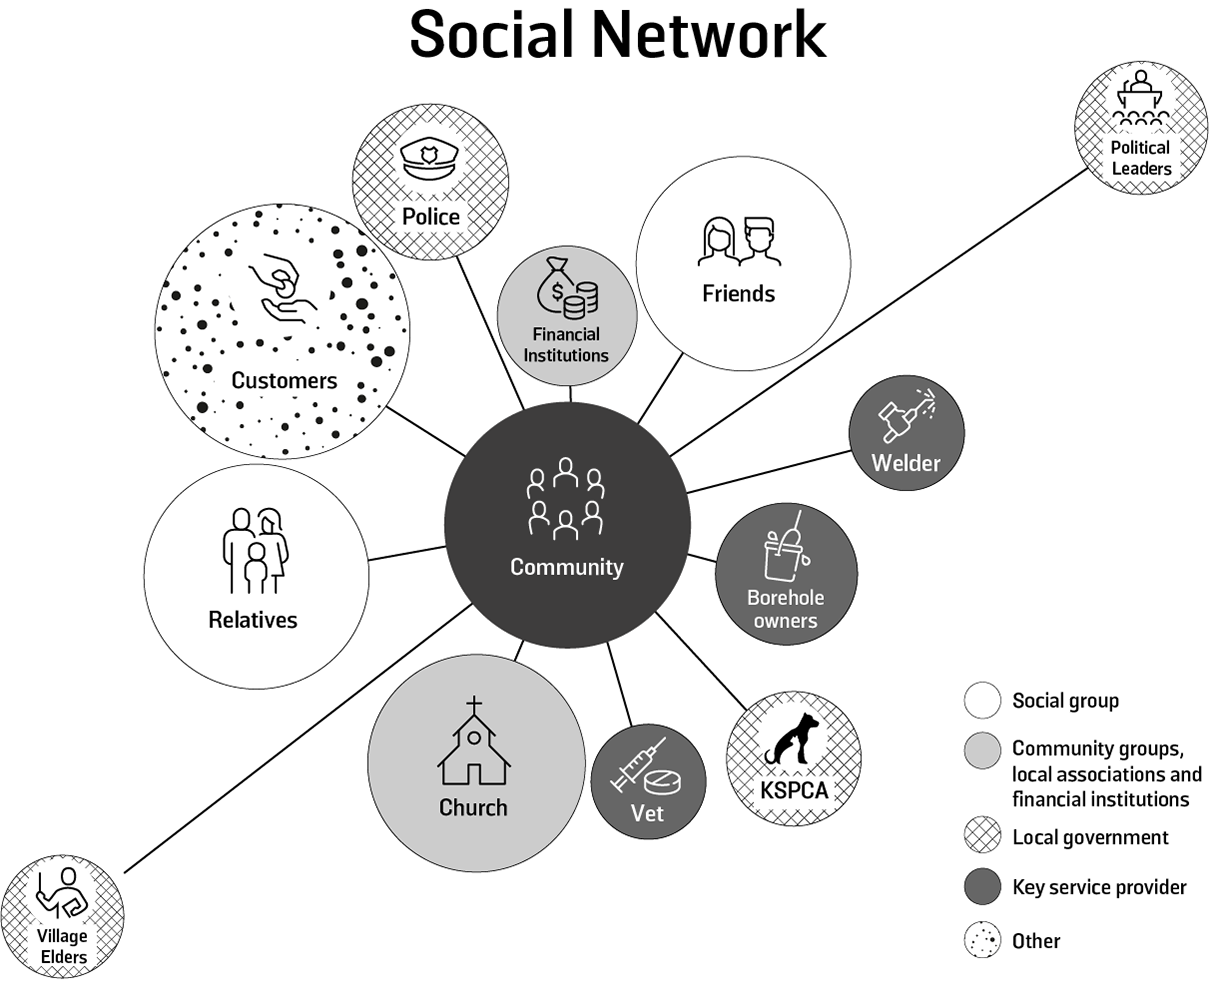
Figure T3B Venn diagram of a social network in Kenya
In the example above, a men’s equine welfare group in Kenya created a simple social network map. The central circle represented their community and different coloured circles were used to represent individuals, groups and other key actors with whom participants had relationships that were perceived to have an impact on their lives and the lives of their animals. Lines were drawn from each social connection to the centre, with the length of line representing the perceived strength of each relationship. The size of each circle represented the perceived importance of each relationship to their lives of the lives of their animals. In Kenya, as village elders have provincial administration capacity they are considered and categorized under local government. KSPCA (Kenyan Society for the Protection and Care of Animals) is also a non-governmental organization that has a mandated protection that is directly linked with the government.
Social Network Venn Diagram
Step 1
Start by explaining the purpose of the exercise and ask participants to identify people, groups, and key actors that they perceive as significant to theirs and their animals’ lives. Use the following types of individuals, groups, andkey actors (not resources) as a guide for probing the community, whilst keeping the conversation animal related.
You can add more as contextually appropriate:
• Social groups (e.g. close friends, relatives, neighbours) • Community groups, local associations and organizations, local financial institutions (e.g. self-help group) • Local government staff (e.g. social service officers) • Non-governmental organization (NGO) and/or agency staff • Key service providers • Others e.g. employers, market buyers/sellers, financial service providers
Ask if there are any individuals, groups or organisations missing from the social network which, if existed, could better help meet household needs and/or the needs of your animal? Why are they missing and why are they needed?
Ask the helper to write responses on different note cards or pieces of paper, asking the group which ones are most important (large circles), important (medium circles) and least important (small circles) ensuring they are colour categorised as above, using words or symbols and place them on the ground for all to see.
Step 2
Ask the helper to draw a circle in the middle of the chart paper or on the ground and make a symbol representing their community in the centre. Organize all cards in large circle around the community circle.
Next, ask participants to move the cards around the centre circle as per the relative strength of the relationship with those actors. Those closest to the centre represent the strongest relationships, while those farthest away the weakest. The facilitator should clarify the criteria that makes a weak versus a strong relationship, such as accessibility, availability, and level of satisfaction and whether they have a positive or negative impact on theirs and their animals’ lives. Place a symbol (e.g. +/- OR happy/sad face OR green/red dot) on each actor’s card to indicate the nature of the relationship, making sure it reflects the impact on both humans and animals.
Step 3
Once all cards have been placed, ask participants which of the actors support their animals specifically. Mark the card with coloured dot or sticker representative of the animal. The more the dots or sticker representing the animal are placed on an actor, the more support the actor provides.
Step 4
Ask participants to identify which relationships are accessible by men, women, or both, by placing a different indicative mark on the card (either using pens or stickers, or bean types). If the relationship is accessible to both men and women, ask whether accessibility is equal for both sexes. You may wish to place a > / = / < in between the representative marks or objects to indicate which sex has greater access. If it is just one group (e.g. only men) then this step is not necessary.
Step 5
Once the social Venn diagram is complete, encourage participants to discuss what it shows (if not already identified through previous discussions).
Consider using the following questions as a guide:
• Why are some relationships perceived to be more or less important? • Why are certain actors more important for men or women? (If identified) • Are there differences between men, women and/or children within the household? • Why are some actors positively or negatively affecting people and their animals? • What changes in this network could improve yours and/or your animals’ lives? • What can you as an individual or group do to improve your relationships with these actors? • What have you learned because of participating in this activity?
Initiation Phase:
Step 6
The diagram should be documented through photos or recreated on paper. Copies should be made and distributed to the group for their records, future reference and/or action planning. Add a copy to your project action tracker.
Planning Phase:
Step 7
Have the community helper record any actions the group agrees to the community action plan. Record the community’s agreed actions and activities in your project action tracker and support the community by following up with any identified key stakeholders.
Facilitation notes: Social Network Mapping
Knowledgeable individuals can be consulted in advance to help identify key actors within the community, particularly governmental and NGO actors.
Use different coloured note cards or marker colours to represent the different categories of relationships listed above to facilitate diagram analysis upon completion.
Both men and women should be asked to participate, as they may have different relationships, value and access to/with actors. If it is not feasible or appropriate to conduct this activity with both men and women, conduct it separately.
Consider having a co-facilitator/note-taker for this activity so that important insights from discussions can be effectively captured.
The facilitator must focus the group on identifying primary types of individuals, groups, and key actors, rather than focus on actual names, as this will be different for every participant and will make it difficult for them to identify the relative importance or influence of these relationships in the next steps.
Facilitators should not control or insert their ideas into the diagram, but rather facilitate the process so that people design it themselves. Probing questions may be used to encourage people to think about the general categories of individuals, groups and actors to include.
Dominant personalities may take over during these discussions and the facilitator must make sure to involve people who are left out. Continue to seek out and encourage input from those who are not participating throughout the exercise. Ask if others agree with ideas of dominants, and consider assigning tasks to different persons throughout the exercise e.g. placement of cards, symbols etc.
Often community members do not know the names of key government or NGO actors. In this case, encourage participants to simply explain the nature of the relationship or activities undertaken by these actors and investigate them later.
Using paper cards or sticky notes is helpful as it allows participants to move cards around throughout the discussion. Consider using different colour papers or markers to represent different types of actors and create meaningful contrast and easier analysis upon completion of the activity.
In the rapport building phase, the community leaders and chiefs will likely be in attendance and, therefore, a clear and accurate picture of the social system may not be possible, as participants may not feel possible speaking freely. Once trust is established and the group size is smaller, the facilitator will come to understand the true social dynamics.
Next Steps
Plan to support the community to strengthen or develop relationships with key actors to support animal welfare improvements and address gaps in services.
Keep a list of key stakeholders identified as important to the lives of the participants. Arrange meetings with them to discuss collaborations or future implementation activities (e.g. service providers, government officials, NGOs).
Consider inviting identified relevant community leaders or active members of society to future meetings to help strengthen relationships and collaborations between the groups.
A seasonal calendar is used to plot changes over the annual cycle. This tool provides a visual representation of seasonally varying phenomenon, such as production activities, illness and disease, migration patterns and much more [48]. This is a useful exercise to carry out with a community as part of a needs assessment and shared vision, which identifies mitigating action. This tool enables people to analyse changes across seasons in the lives of animals as well as their owners, users and/or carers, as well as how these changes may be linked to each other.
Tool purpose:
Time needed:
• To identify periods of availability and scarcity (water, food, income) to target programme activities • To identify periods of lowest and highest risk (disease, poor health, poor body condition) to target programme activities • To identify potential linkages or causal factors related to the livelihoods of animals’ owners, users and carers
1.5 - 2 hours
Materials needed:
Chart paper and markers or sticks, stones, straw, leaves, beans, seeds, pulses, coloured sand or chalk powder and/or any other locally available materials to represent each aspect in the chart
Keyword Search Tags
Project Phase: Initiation Phase
Approaches for Working With Communities: Community Development Approach, Community Engagement Approach
Behavioural Drivers (COM-B): Opportunity
Project Support: Participatory Learning and Action Tools, Needs Assessment
Specific Topics: Animal Health and Services; Livelihoods; Vulnerability/Resilience, Animal Welfare, Feelings, and Needs
Seasonal calendar of the lives of animals, their owners, users and carers
The seasonal calendar can include many aspects of life. For example, it may highlight changes in animal welfare according to seasonal variations in workloads or availability of feed, which may also be associated with changes in household income and/or expenditure. It can help the community to decide actions to improve animal welfare and plan ahead to prevent welfare from getting worse in difficult seasons, as well plan alternative livelihood strategies for times when their working animals will not be required, required less or for different purposes. Each important aspect is identified and defined by the community.
Different criteria is agreed by the community to illustrate seasonal variations in:
festivals, religious ceremonies, important local events
household income
household expenditures
consumption of animal feed and fodder, grazing or other resources
seasonal prevalence or incidence of animal diseases
general health status of people in animal-owning households
the general body condition or welfare status of animals
availability of water and/or other important natural resources
availability of work or employment and other livelihood related activities
work load of animals and humans e.g. periods of heavy work or periods of relative ease
migration patterns of animal-owning families
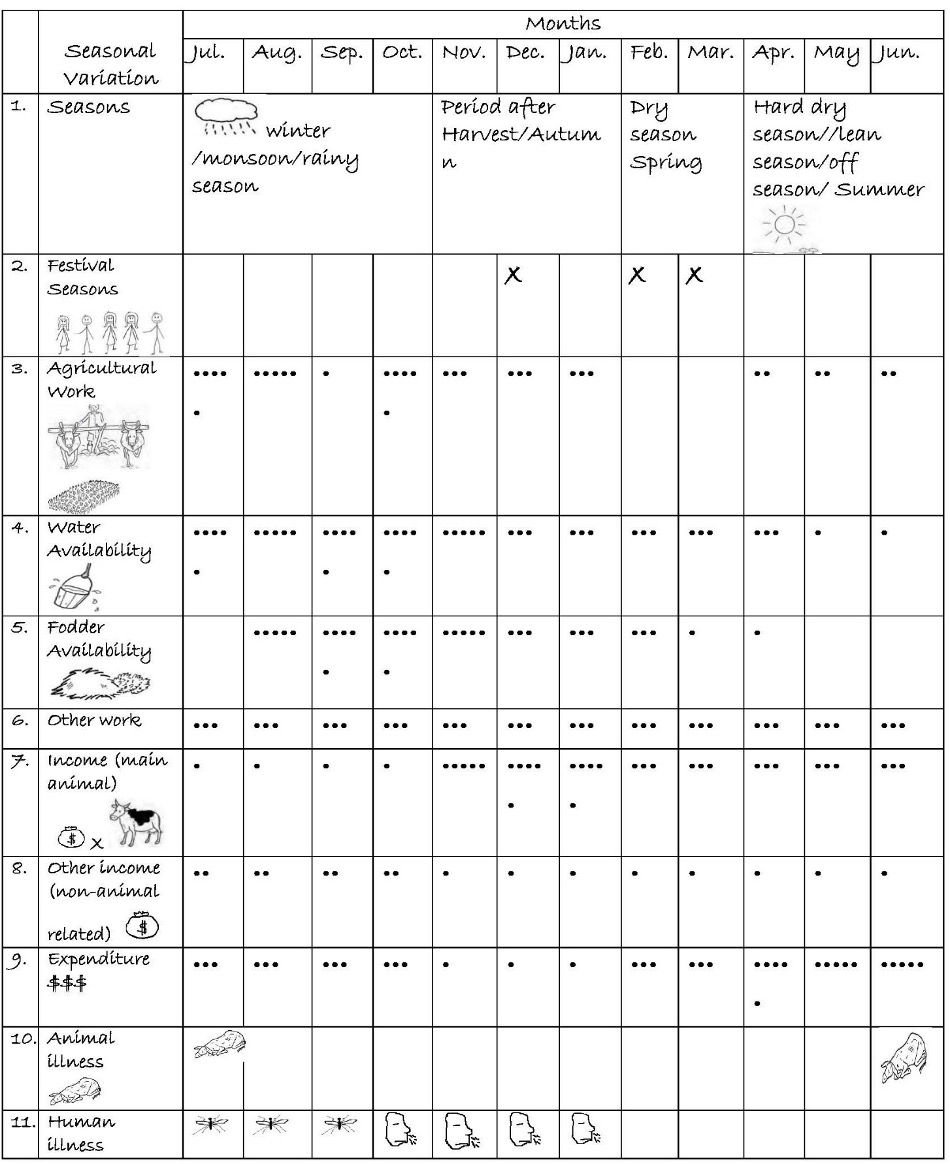
Figure T6 Seasonal calendar created by a group of animal owners in Thies, Senegal
The example above was conducted with a community, whose livelihoods depend on animals, especially during periods of agricultural harvest. Men and women primarily rely on animals to support their livelihoods, but have additional sources of income throughout the year. From this calendar, we come to understand:
There are four seasons: Winter/Rainy or Monsoon season, Autumn/Harvest time, Spring/Dry Season, and Summer/Lean Season (1st row)
Two major festivals take place (2nd row) in December and January/February
Water (4th row), harvesting (3rd row) and fodder availability (5th row) are extremely low or non-existent during the dry season (Aug-Sept) and highest during the rainy season (Oct-Dec).
Animal-related (7th row) and non-animal related (8th row) income varies between men and women, with women bringing in more non-animal-related income (8th row) throughout the year and men bringing in more animal-related income (7th row) generally.
Both income (7th & 8th rows) and household expenditure (9th row) go up during festival months.
There appears to be a relationship between animal body condition (10th row), availability of feed/fodder (5th row) and disease prevalence in animals (9th row):
Animal body condition is worse and disease prevalence (9th row) higher during summer season (Jun - July), when there is low water availability, no fodder.
Human health is also worse during the winter months (July-Sept). The issue of diseases (11th row), discussions focused on the most disease prone periods. For more details, during this exercise the communities indicated that from July to January, there is usually an outbreak of seasonal diseases like Malaria, during the rainy season (July-August-September), and; seasonal flu from October to January. Communities indicated that the fatigue accumulated during the harvesting season (3rd row) and water availability (4th row) are some of the aggravating factors.
As far as expenses (9th row) are concerned, there are fewer expenses related to household care just after the harvests. In fact, during this period consumption is mainly derived from the harvest, and expenditure concerns other aspects such as education and health. Sometime afterwards, expenditure increases due to the reduction in food stocks and the need to prepare for the next season (seeds, inputs, etc.). Taking care of the animals during this period also requires expenditure due to the scarcity of grasses.
Seasonal Calendar of the Lives of Animals and Communities
Step 1
a) Start a discussion by asking participants about the local calendar and seasonal landmarks, for example dry or rainy seasons, before or after festival periods or religious ceremonies. b) Ask the helper to draw a matrix on the ground or large piece of chart paper and list the identified seasons on the horizontal (top) axis including the months in which they fall. c) On the first line of the vertical axis, add the identified seasonal landmarks (1a). Instead of words, the group may identify unique characteristics of each season and depict these using a symbol or drawing.
Step 2
a) Move on to a discussion about the present season and their main work during this season. Add the work to the vertical axis. Then ask about: b) Other work during the year c) Income generated from the main work d) Income generated from the other work e) general house expenditures throughout the year f) Big issues related to animals and humans, such as: • Animal illness/disease • Human illness/disease • Availability of water/feed/fodder, etc.
Step 3
Decide with the group how they will display the situation. Encourage participants depict seasonal changes using locally available materials. You may also use symbols or simply write words on cards.
For example:
• Higher income levels can be shown by placing a lot of seeds/money on the month in which this occurs, while a decrease in income the next month is shown with just a few seeds. - Figure T6 used dots, or you can use dollar signs ($) for income, whereby five dots or $$$$$ = high income and a single dot or $ = low income (Rows 7, 8, 9)
• On the same note, you can use the dots to represent abundance or scarcity. Abundance can be represented by 5 dots whereas a single 1 dot represents scarcity; and those in between can show relative references to abundance or scarcity. - Figure T6 used 5 dots for periods of high-water availability, 3 dots for average water availability and 1 dot for periods of water scarcity (Row 4).
• You can also use by shading Dark colours to represent periods of abundance and light colours periods of scarcity.
Step 4
Explore the relationships between different seasonal events, activities and problems for animals and humans, especially those that show changes at the same time. The availability of resources either in the form of fodder or water availability or income or spending shows you what kind of physical opportunities are available to create an enabling environment for people to change their behaviour towards their animal’s welfare.
Also discuss any similarities between the well-being of animals and humans throughout the seasons. Once the calendar is complete, discuss the results of the activity with the group.
Step 5
Record the community’s analysis and responses in your project action tracker. Leave the seasonal calendar with the community and take a copy/picture for your records. Follow up with the community later when you start action planning together.
Facilitation Notes
In exceptional cases, where there are more than 20 people in the group, consider dividing participants into smaller groups to compare the seasonal changes amongst different groups of people. Encourage people to arrange themselves into the smaller groups with those they feel share greatest similarities (e.g. men / women, owners / users).
It may be helpful to have more than one facilitator to support/facilitate small group work and discussions, especially if there are many participants.
Before starting this exercise, discuss the calendar focus areas (which specific aspects will be examined) and how it will be used to analyse how the welfare of working animals and their related livelihoods and well-being change in different seasons. Also, how certain changes may be linked or cause challenges in their capacity to care for their animals.
Be clear that the aim of the activity is to discuss how seasonality affects animal welfare and people’s livelihoods and identify challenging seasons. In this way, participants’ expectations can best be managed, and potential frustrations or perceptions that facilitators are more interested in animals’ well-being than people, can be mitigated. This is particularly important given that some changes in livelihoods and well-being may be identified, but it may be beyond the capacity of the project to address them.
New facilitators might look into historical weather and food security reports (FEWS NET) to gain an understanding of seasonal challenges that the community might be facing before meeting with the group, which will help with identifying dry/lean, rainy/fruitful seasons and historical water shortages.
Next Steps
Seasonal calendars during the rapport building stage might accompany or be created alongside one or more of the following tools:
T3 Venn Diagram (T3a Resources and Services Venn Diagram) to understand identify animal-related resource and service providers animal-owning communities rely on most and their level of satisfaction with each one
T4 Daily Activity Schedule to understand how people and animals in animal-owning communities spend their time
This PLA tool can support identification of community priorities related to a variety of topics, and you are encouraged to adapt the tool as needed to address topics relevant to your project.
Step-by-step guidance for conducting this activity is provided related to the following three topics:
T8a: Pairwise Ranking and Scoring of Animal Welfare Issues
T8b: Pairwise Ranking and Scoring of Animal Health Service Providers
T8c: Pairwise Ranking and Scoring of Animal Diseases
T8a: Pairwise Ranking and Scoring of Animal Welfare Issues
This tool uses a matrix to make direct comparisons between issues, such as beating, over-loading, poor feeding practices, etc. It is used to prioritize welfare issues for taking action, which can be a useful next step after participatory welfare needs assessment (See T22 Animal Welfare Transect Walk) has been carried out. This tool is similar to T9 Matrix Ranking and Scoringin that it prioritizes issues important to communities, however does so in a quicker and simpler way, without explicitly including criteria participants use when prioritizing issues. However, reasons for particular preferences can still emerge during discussions as participants decide on their priorities. As such, this tool may be used instead of, or before a more in-depth matrix ranking and scoring activity.
Tool purpose:
Time needed:
• To support animal owning communities in identifying the animal welfare issues they feel are the biggest priorities to address
1.5-2 hours
Materials needed:
Coloured powder, chalk, stick, tree leaves, coloured cards; chart paper and markets, or other locally available materials to represent identified criteria.
Keyword Search Tags
Project Phase: Planning Phase
Approaches for Working With Communities: Community Development Approach, Community Engagement Approach
Specific Topics: Animal Welfare, Feelings, and Needs
Pair-wise ranking and scoring of animal welfare issues
T8A Pairwise ranking and scoring of animal welfare issues in Faisalabad, Pakistan
A group of animal owners in a Brick kiln community in Faisalabad, Pakistan, ranked animal welfare issues identified in their locality according to the level of prioritization. The identified lack of available shade/shelter, inadequate provision of water, inadequate provision of mixed feed, overloading, beating and lack of timely treatment. Inadequate provision of water (score 5) and inadequate provision of mixed feed (score 4) were seen as the first and second important animal welfare issues, respectively. Participants agreed to discuss ways to address these priority issues in their next group meeting.
Pair-wise ranking and scoring of animal welfare issues
Step 1
Start by explaining the purpose of the exercise.
Ask one or two community helpers to create a matrix on the ground or chart paper. Have a minimum of six (6) rows and columns, with room to add more should the community identify more than five animal welfare issues. Have one of the community helpers draw a line from the top left diagonal corner to the bottom right diagonal corner. Cross out the boxes below the diagonal line to avoid duplication.
At the same time, ask the community to identify animal welfare issues that are common in the area. Have another community helper record them on cards. Use representative names, symbols, abbreviations, or locally available materials to depict the issues, such as different tree leaves. Make two sets of symbols for each identified issue. Place one set of names/symbols in the first column, from top to bottom. Then place the second set of names/symbols in the top row, from left to right.
Please note: It is the facilitator’s job to help the community reduce the number of animal welfare issues to a maximum of six to eight (6-8) that are most common to the community should they come up with a long list.
Please note: Ensure that you have multiple copies of the symbols to prepare for the prioritisation.
Step 2
One by one, compare each name/symbol in the columns with each symbol in the rows. Encourage participants to discuss which animal welfare issues they would prioritise over the other and ask why. Have the community members place the preferred name/symbol in the relevant box in the matrix.
Please note: Coming to an agreement on the priority animal welfare issues may cause some debate amongst participants. These discussions are important as they generate understanding of the rationale underlying participant’s prioritisation of issues. As a facilitator, allow and encourage this discussion without inserting your ideas. Ask the community helper to record the reasons for their prioritisation.
Step 3
Count the number of times each option appears in the matrix. Add them up and record totals at the bottom of the matrix using seeds, pebbles, or numbers (scoring). Then make a list of the options with the most prioritised animal welfare issue ranked first.
Once complete, consider using the following questions to generate a discussion about the results:
• Does everyone agree on the prioritised issues? • What is the impact of the prioritised issues on animal-owning households? (e.g. livelihoods) • What can be done to improve the prioritised animal welfare issues? • Who needs to do what? • What opportunities exist for participants to address the priority animal welfare issues and/or improve their current animal husbandry and management practices?
Step 4
Summarize the results of the activity and have the community helper add any actions and activities to the community action plan. Agree on a date and time for the next session.
The matrix should be left with the community. Make a copy or take a photograph for your reference for future discussions and further action planning. Add a copy to your project action tracker.
Facilitator’s notes: Pair-wise ranking & scoring of animal welfare issues
If the number of items to be compared is too large, this exercise can become boring for participants. In this case, help participants to reduce the list by focusing on a smaller number of prioritised items.
Make sure the animal welfare issues are very clear and precise. For example, if the community identifies water, clarify whether the issue of water is about water provision, water access/availability, water distance, etc.
The discussions that people have about why they choose one option over another are just as important as the result. It is important to allow these discussions to happen. Take notes on the criteria participants use to decide on their priorities.
Some diseases and conditions may be identified as a major animal welfare issue in the community, such as colic. These may also be included in the issues list.
This activity might identify potential influencers. Consider involving them in to future sessions to help strengthen the identified opportunities for change.
Next steps
Use understandings gained about what motivates animal-owning communities to inform the design of projects and/or strategies
Priority issues agreed by the group for further exploration and/or action may be revisited during community action planning and included in relevant sections of the community action plan (e.g. issues and action sections)
T26 Animal Welfare Cause and Effect Analysis to identify and promote understanding of the root causes of priority animal welfare issues and related implications for people and animals
T8b: Pairwise Ranking and Scoring of Animal Health Service Providers
This tool uses a matrix to make direct comparisons between animal diseases common to a community. It is used to prioritize animal diseases to address, which can be a useful next step after participatory welfare needs assessment (See T22 Animal Welfare Transect Walk) has been carried out. This tool is similar toT9 Matrix Ranking and Scoringin that it prioritizes diseases important to communities, however does so in a quicker and simpler way, without explicitly including criteria participants use when prioritizing issues. However, reasons for particular preferences can still emerge during discussions as participants decide on their priorities. As such, this tool may be used instead of, or before a more in-depth matrix ranking and scoring activity.
Tool purpose:
Time needed:
• To support animal owning communities in identifying and prioritizing animal diseases to address.
2 hours
Materials needed:
Coloured powder, chalk, stick, tree leaves, coloured cards; chart paper and markets, or other locally available materials to represent identified criteria
The matrix below compares common diseases in working animals and identifies which of them are perceived to be the biggest problem by the community. This activity helps people to understand the common diseases in their community and local area and can be used to inform the T26 Animal Welfare Cause and Effect Analysis.
T8B Pairwise scoring and ranking of animal diseases
A group of animal owners identified, compared and ranked six diseases, using tree leaves as symbols for respiratory problems, surra (trypanosomiasis – biting flies), worm infestation, ectoparasites, wounds and tetanus. This showed that tetanus was seen by the group to be the biggest welfare problem, followed by surra. Though worm infestation was initially identified as one of the most important diseases, it was found to be less important than other diseases during pair-wise comparisons. This tool was used to inform action planning and followed up with a T15 Cost-Benefit Analysis. The community decided to take up community-led vaccination of their animals against tetanus.
Pair-wise ranking and scoring of animal diseases
Step 1
Start by explaining that the purpose of the exercise.
Ask one or two community helpers to create a matrix on the ground using coloured powder, chalk, or a stick or on chart paper using markers. Have a minimum of six (6) rows and columns, with room to add more should the community identify more than five diseases. Have one of the community helpers draw a line from the top left diagonal corner to the bottom right diagonal corner. Cross out the boxes below the diagonal line to avoid duplication (see Figure T8b).
At the same time, start by asking the community to identify diseases that are commonly found in the area. Have another community helper record them on cards. Use representative names, symbols, abbreviations, or locally available materials to depict the diseases, such as different tree leaves. Make two sets of symbols for each identified disease. Place one set of names/symbols in the first column, from top to bottom. Then place the second set of names/symbols in the top row, from left to right.
Please note: Depending on the context, the participants may call refer to the diseases by local names and identify them by sign, symptom, effect and/or seasonality. The facilitator should have a good basic knowledge of diseases in the area to identify them.
Please note: It is the facilitator’s job to help the community reduce the number of diseases to a maximum of eight (8) should they come up with a long list.
Step 2
One by one, compare each name/symbol in the columns with each symbol in the rows. Encourage participants to discuss which disease they would prioritise over the other and ask why. If a second facilitator is available, have him/her record the reasons for their prioritisation. If one is not available, remember to later record the reasons after the session.
Please note: Coming to an agreement on the priority diseases may cause some debate amongst participants.
These discussions are important as they generate understanding of the rationale underlying participant’s prioritisation of diseases. As a facilitator, allow and encourage this discussion without inserting your ideas. Have the community members place the preferred name/symbol in the relevant box on the matrix
Step 3
Count the number of times each option appears in the matrix. Add them up and record totals at the bottom of the matrix using seeds, pebbles, or numbers (scoring). Then make a list of the options with the most prioritised disease ranked first.
Once complete, consider using the following questions to generate a discussion about the results:
• Does everyone agree on the prioritised diseases? • What is the impact of the prioritised diseases on animal-owning households? (e.g. livelihoods) • If they have not been identified through the activity, ask what are current disease prevention and treatment practices? • What can be done to prevent the prioritised diseases?
Step 4
Summarize the results of the activity and have the community helper add any actions and activities to the community action plan. Agree on a date and time for the next session.
The matrix should be left with the community. Make a copy or take a photograph for your reference for future discussions and further action planning. Add a copy to your project action tracker.
Facilitator’s notes: Pair-wise ranking
If the number of diseases to be compared is too long, this exercise can be boring. In this case, help participants to reduce the list of by focusing on a smaller number of prioritised diseases.
The discussions that people have about why they choose one option over another are just as important as the result. It is important to allow these discussions to happen. Take notes on the criteria participants use to decide on their priorities.
Participants may not know the scientific names of diseases and will have local names for them. The facilitator should have basic knowledge of animal diseases when participants come up with signs, symptoms, effects and seasonality in order to identify them.
Next Steps
Use understandings gained about what motivates animal owning communities’ to inform the design of projects and/or strategies
Priority diseases agreed by the group for further exploration and/or action may be revisited during community action planning and/or included in relevant sections of the community action plan (e.g. issues and action sections)
T8c: Pairwise Ranking and Scoring of Animal Diseases
This activity uses a matrix to make direct comparisons between resource and service providers. This tool is similar to matrix ranking and scoring (T9), as it prioritizes animal related resources and service providers important to communities, however does so in a quick and simple way, without including criteria participants use when prioritizing. However, reasons for their particular preferences can emerge during discussions between participants when priorities are debated.
Tool purpose:
Time needed:
• To support animal owning communities in identifying and prioritizing the local resource and service providers important to their animals’ welfare • To identify types of resource and service providers the project can engage to support animal welfare improvements • To generate peer-peer discussion and learning about the importance of different animal-related resources and services to their animals’ welfare in a process of self-sensitization towards understanding animal welfare needs
1.5-2 hours
Materials needed:
Coloured powder, chalk, stick, tree leaves, coloured cards or other locally available materials to represent diseases, items and service providers
Keyword Search Tags
Project Phase: Planning Phase
Approaches for Working With Communities: Community Development Approach, Community Engagement Approach
Project Support: Participatory Learning and Action Tools, Needs Assessment
Specific Topics: Animal Health and Services
Pair-wise ranking and scoring of animal-related resource & service providers
Pair-wise ranking and scoring may be used to analyze several aspects of resource and service providers, such as the importance of each on the welfare of animals, ranking of the quality, cost or availability of different providers (for example the veterinarians, animal health workers, feed, fodder and equipment sellers, etc.) or ranking several providers of the same service, such as the animal health workers in one locality.
T8c Pairwise ranking of resources and service providers in Halaba, Ethiopia
A group of animal owners scored and ranked animal-related resource and service providers in Halaba, Ethiopia, according to who they found most important for the welfare of their animal. They started by identifying the animal-related resource and service providers, including the farrier, the animal health service provider, the saddle maker, the shelter provider, the harness maker and the feed seller. The shelter provider, with whom they rent shelter space, was seen as the most important, as their animals are at risk at being attacked by hyenas at night. The shelter is important for preventing injury or death of animals. The second most priority animal-related service provider was the feed seller, as there is not enough available land and grass for grazing during the year since the area is highly prone to drought.
Pair-wise ranking and scoring of animal-related resource and service providers
Step 1
Start by explaining that the purpose of the exercise.
Ask one or two community helpers to create a matrix on the ground using coloured powder, chalk, or a stick or on chart paper using markers. Have a minimum of six (6) rows and columns, with room to add more should the community identify more than five criteria. Have one of the community helpers draw a line from the top left diagonal corner to the bottom right diagonal corner. Cross out the boxes below the diagonal line to avoid duplication (see Figure T8C).
At the same time, start by asking the community to identify the animal-related resource and service providers that are important for animals’ welfare. Have another community helper record them on cards or post-it notes. Use representative symbols, abbreviations, or locally available materials to depict the resource and service providers, such as different tree leaves. Make two sets of symbols for each identified resource and service provider. Place one set of symbols in the first column, from top to bottom. Then place the second set of symbols in the top row, from left to right.
Please note: It is the facilitator’s job to help the community reduce the number of resource and service providers to a maximum of eight (8) should they come up with a long list.
Please note: Ensure that you have multiple copies of the symbols to prepare for the prioritisation.
Step 2
One by one, compare each symbol in the columns with each symbol in the rows. Encourage participants to discuss which resource or service provider they would prioritise over the other and ask why. If a second facilitator is available, have him/her record the reasons for their prioritisation. If one is not available, remember to later record the reasons after the session.
Please note: Coming to an agreement on the priority resource and service providers may cause some debate amongst participants. These discussions are important as they generate understanding of the rationale underlying participant’s prioritisation of resource and service providers. As a facilitator, allow and encourage this discussion without inserting your ideas.
Have the community members place the preferred symbol in the relevant box on the matrix.
Step 3
Count the number of times each option appears in the matrix. Add them up and record totals at the bottom of the matrix using seeds, pebbles, or numbers (scoring). Then make a list of the options with the most-preferred option ranked first.
Once complete, consider using the following questions to generate a discussion about the results:
• Does everyone agree on the prioritised resource and service providers? • Are you satisfied with the available resource and service provision?
Summarize the results of the activity and agree a time to schedule a follow-up session to undertake next steps as relevant to the context.
Step 4
The matrix should be left with the community. Make a copy or take a photograph for your reference for future discussions and action planning. Add a copy to your project action tracker.
Facilitator’s notes: Pair-wise ranking
If the number of items being compared is too long, this exercise can be boring for participants. In this case, assist participants in reducing the list by focusing on a smaller number of prioritised service providers.
The discussions that people have about why they choose one option over another are just as important as the result. It is important to allow these discussions to happen. Consider asking a second facilitator to join you in order to capture the information that comes from the discussion or document them yourself after your community visit.
Depending on the context, , consider carrying out this activity separately between men and women or different groups of people in the project’s planning phase (e.g. owners, users, carers) and compare the results. Differences in the roles people play in animals’ lives and/or how they depend on their animals can influence how people prioritise choices. Discuss any differences in their responses and reasons for those differences.
This activity might identify potential local service provider influencers. Consider involving them in to future sessions to help strengthen the identified opportunities for change.
Next Steps
T9 Matrix Ranking and Scoring to deeply analyze the resource and service providers based on selected criteria to understand the barriers
T15 Cost-Benefit Analysis to explore the risks and opportunities of using one service or resource provider over another
This PLA tool can support identification of community priorities related to a variety of topics, and you are encouraged to adapt the tool as needed to address topics relevant to your project. Step-by-step guidance for conducting this activity has been adapted from another matrix ranking/scoring tool for the following three topics: a) Animal Related Issues, b) Animal Service Providers, c) Sources of Credit [48].
T9a: Matrix Ranking and Scoring of Animal Welfare Issues
This tool uses a matrix diagram to compare animal-related issues based on community-identified reasons/criteria[1]. Matrix scoring and ranking differs from pair-wise scoring and ranking because it scores and ranks issues based on criteria agreed by participants during the exercise, rather than identifying priorities in relation to each other. This exercise enables participants and facilitators to identify priorities and gain a better understanding of the reasons underlying community’s preferences and choices and how the decision-making process happens within the group.
Tool purpose:
Time needed:
• To support animal owning communities in identifying their priority animal-related issues to address • To identification of determining factors informing animal owning communities identification of priority issues. • To understand differences in priority animal welfare issues and the criteria used to inform prioritization when activity conducted and results compared between different groups (owners/users/carers, men/women).
2 hours
Materials needed:
chart paper, pens/markers or chalk/coloured dust, stones, pebbles, local materials (leaves, seeds, etc.) Pictures if available.
Matrix ranking and scoring of animal-related issues
Matrix ranking and scoring can be used to identify and understand animal-related issues based on reasons/criteria agreed by participants. The tool can similarly be used with a greater focus on animal diseases specifically.
In the example below (Figure T9a), members of animal-owning households prioritized their working animal-related issues in terms of those felt to be most problematic, scoring each issues out of five and then ranking them. The group agreed to use frequency, severity/change of death, treatment cost, potential loss of work/income, challenging to treat to score and rank each issue. They agreed that 5 would be most serious/severe and 0 would be least serious/severe. The animal-related issue that had the highest cumulative score would be ranked as the number one priority, as it has the most severe consequences for the animal-owning households.
Figure T9a Matrix scoring and ranking of working animal-related issues
As a result of this exercise, participants identified lameness (19) as being the most significant issue, with colic (16) and hoof problems (16) were the second most important animal-related issues for the community. They decided to explore these issues further in their next session to understand the root causes.
Scoring and Ranking of Animal-related Issues
Step 1
Start by asking participants to prepare a list of animal-related issues. This could also be informed by previous discussions or tools. Alternatively, ask the group what animal-related issues can be or have been a problem in the past. It is important that the community come up with their own ideas and not be led by the facilitator. Ask the helper to draw a matrix and list the animal-related issues in the first column.
Step 2
Ask the group which issues are most problematic and note the reasons why. Once the first reason is identified, encourage the group to think about other reasons. Try to group similar reasons together, such as loss of work and loss of income (Figure 9a). Have the helper add the reasons/criteria along the top row of the matrix. If there are too many criteria, encourage participants prioritise the most important ones.
Once identified, assist participants in framing the criteria as either all positive or all negative, which will keep scoring consistent and prevent confusion. For example, criteria related to cost may be framed positively as affordable or negatively as costly. Using both positive and negatively framed criteria together (e.g. easy to address (+), costly (-) might confuse the ranking or scoring process, by mixing high scores with negative meaning and positive meaning. In T9a example, 5 = serious/severe/problematic, while 0 = non-serious/mild/non-problematic.
Step 3
Ask the group to score the animal-related issues listed in the first column against each of the criteria listed along the top row using up to five seeds or stones. Allow enough time for an in-depth discussion on the reasons for chosen scores and consensus reaching. Have the helper take notes for the reasons for choosing each score.
Step 4
Once completed, ask the group to total each row (issues) based on the scores. Then rank the issues with the highest ranking = 1, next highest =2, and so on.
Facilitate the group to draw conclusions from the exercise by asking:
• Which issue (row) had the highest and lowest scores? • Does everyone agree on the ranking? • What were the reasons for these scoring decisions (if not already identified)? • What is the significance of these scores to you? • Which issues are the highest priority to address and why?
If participants express an interest in addressing their priority issues, encourage them to analyse the root causes or major contributing factors to their priority issues as a next step.
Step 5
The matrix should be left with the community and prioritised issues added to a community action plan, which can be addressed later. Take a copy and add it to your project action tracker for future discussions and action planning
Facilitation Notes
Keep the group focused on the chosen topic, as this exercise has the potential to deviate from the original focus.
Consciously or unconsciously, there may be a tendency for facilitators to include their own criteria, rather than those of the community. Encourage participants to come up with their own criteria and avoid inserting your own ideas. Some criteria may seem strange. If participants consider it important, it needs to be respected and rationale understood.
Depending on the context, at the planning phase consider carrying out this activity separately between men and women or different groups of people (e.g. owners, users, carers) and compare the results. Differences in the roles people play in animals’ lives and/or how they depend on their animals to meet different needs can influence how people prioritize issues and make choices to act. Discuss any differences in their responses and reasons for those differences.
Encourage participants to explore the root causes of welfare issues or challenges prior to planning actions; this will promote the identification of more effective and sustainable solutions. This can be part of discussions at the end of the activity or see next steps for recommended follow-up activities to support root cause analysis.
Criteria should be either all positive or all negative: mixing positive and negative criteria can be confusing.
Explore the costs and benefits to people and animals of different solutions to prioritized issues, including preventative and treatment options, thereby helping to generate motivation to take action
Generate greater motivation to address non-prioritized issues by helping participants’ frame issues in terms of risks and opportunities
T9b: Matrix Ranking and Scoring of Animal Service Providers
This tool uses a matrix diagram to compare resource and service providers based on pre-determined criteria[1]. Matrix ranking and scoring differs from pair-wise ranking because it ranks or scores issues or items based on criteria agreed by participants during the exercise, rather than identifying priorities in relation to each other. This exercise enables participants and facilitators to identify priorities for animal-related resource and service providers and gain a better understanding of the reasons underlying community’s preferences and choices, and how the decision-making process happens within the group. Try to conduct this activity separately with owners, users and carers, including both men and women, or other relevant groups if they are likely to have different priorities.
Tool purpose:
Time needed:
• To identify priority resource and service providers • To understand criteria animal-owning communities use to make choices in their use of resources and services • To compare differences in animal and resource service provider priorities and the underlying rationales informing choices between different groups (e.g. men and women, owners/users/carers).
2 hours
Materials needed:
Chart paper and markers or using sticks, stones, straw, local resources
Matrix scoring of animal-related service providers
Service providers available in the locality are scored or ranked (see Figure T9b and T9c) against criteria participants identified as important to informing their use preferences. This exercise may be used to compare several providers of the same service (e.g. all the feed sellers) or may also be used to compare providers of different services (e.g. farrier vs agrovet vs community animal health worker etc.) Refer back to the results of T3 Venn diagram to understand the rationale for why participants rely on the animal resource and service providers. Consider using this activity to build upon the priorities identified in T8: Pairwise ranking of animal-related service and/or resource providers. However, the activity can be just as effective for prioritizing issues if used independently.
In the examples below, the services of five local animal health service providers were compared by participants within a community using a matrix scoring exercise.
Figure T9b Matrix scoring of preferences for local animal health service providers
Participants identified six criteria which they agreed were important to choosing a service provider: quality service, timely response, affordability, close proximity (distance), offers credit/repayment and friendliness/good relationship. They then scored each of the five service providers against each criteria using five seeds. Through a final discussion, participants decided to invite the prioritized health service provider to their next meeting to strengthen their relationships and negotiate a group rate for the service.
An example of the activity conducted using a ranking approach, rather than a scoring approach is also provided below for reference. The criteria are listed from top to bottom, with service providers listed from left to right. Participants were then asked to rank each service provider, against each of the criteria. The best service provider scored for the criteria was given a 1. Since there are five service providers, they would be ranked 1-5. In this example, some service providers were ranked equally and provided the same rank.
Figure T9c Matrix ranking of local animal health service providers
Matrix Ranking and Scoring of Animal-related Service Providers
Step 1
Ask participants to identify a list of resource or service providers commonly used. You may wish to refer to results from the T3 Venn diagram activity to help create the list of relevant animal-related resource and service providers for this discussion if available.
Step 2
Next, ask participants to discuss which resource or service providers they prefer to use over others, and ask what their reasons for this preference are. Have participants list all the criteria they identify as informing their preferences for difference service providers. The group can add as many criteria as possible they feel necessary, although if there are many criteria listed, encourage participants to sort out which are the most important ones.
Once identified, assist participants to reframe the criteria as needed to ensure they are either all positive or all negative. For example, a criterion related to cost may be framed positively as affordable, or negatively as costly. It is important that all criteria used either be all positive, or all negative, to ensure consistency in scoring and avoid confusion that can result when calculating final scores or ranking at the end of the activity.
Step 3
Matrix Scoring: For matrix scoring, draw a matrix on the ground with the service providers listed from top to bottom in the first column, and the criteria informing preferences for use across the top row from left to right. Then ask participants use up to ten seeds or stones to score each service provider against each criterion.
Matrix Ranking: For matrix ranking, rather than using seeds to score each service provider against each criterion, draw a matrix on the ground with the criteria listed from top to bottom in the first column, and the service providers for ranking across the top row from left to right. Ask the group to rank all the items based on the first criterion they have chosen. Then rank them all based on the second criterion and so on, until the full list of items has been compared against all the agreed criteria.
Allow enough time for in-depth discussion and analysis of the reasons for ranking or scoring and enough time to come to consensus.
Step 4
When the ranking or scoring is complete, facilitate the group to draw conclusions from the exercise by asking questions.
The following guiding questions may be useful for facilitating this discussion:
• Who scored/ranked highest and lowest? Why? • What is the significance of these scores to you? • Do those results reflect the service providers you must rely on now? If not, why not? • Are you satisfied that the providers you currently rely on are the best options for meeting the needs of you and your animal? • Are there any issues preventing you from increasing your reliance on the high scored/ranking service providers? What would you suggest would need to be different to enable you rely on these service providers? • How might you be able to better access or strengthen your relationship with these high scored/ranked service providers?
Step 5
Any identified priority issues or actions can be added to the community action plan for later discussion and action planning. The matrix should be left with the community. Take a copy and add any actions to take or follow up on to your project action tracker for future reference and planning.
Facilitation Notes
It is very important that the facilitator keep the group focused on the chosen topic, as this exercise has the potential to deviate from the original focus.
Consciously or unconsciously, there may be a tendency for facilitators to include their own criteria, rather than those of the community. Encourage participants to come up with their own criteria and avoid inserting your own ideas. Some criteria may seem strange. If participants consider it important, it needs to be respected and rationale understood.
Depending on the context, at the planning phase consider carrying out this activity separately between men and women or different groups of people (e.g. owners, users, carers) and compare the results. Differences in the roles people play in animals’ lives and/or how they depend on their animals to meet different needs can influence how people prioritize issues and make choices to act. Discuss any differences in their responses and reasons for those differences. If this activity is carried about by a single gender group (men’s or women’s group), information gathered from this activity can help inform your gender analysis and planning.
Encourage participants to explore the root causes of welfare issues or challenges prior to planning actions; this will promote the identification of more effective and sustainable solutions. This can be part of discussions at the end of the activity or see next steps for recommended follow-up activities to support root cause analysis.
Criteria should be either all positive or all negative: mixing positive and negative criteria can be confusing.
Facilitators must be clear about the specific topic being examined to keep the group focused.
Use understandings gained about what motivates animal owning communities to choose one resource or service provider over another to inform the design of projects and/or strategies.
T9c: Matrix Ranking and Scoring of Sources of Credit
This tool has been adapted from another matrix ranking/scoring tool to use a matrix diagram to compare sources of credit based on pre-determined criteria [48]. Matrix ranking and scoring differs from pair-wise ranking because it ranks or scores based on criteria agreed by participants during the exercise, rather than identifying priorities in relation to each other. This exercise enables participants and facilitators to identify priorities and gain a better understanding of the reasons underlying community’s preferences and choices for credit providers, and how the decision-making process happens. Try to conduct this activity separately with owners, users and carers, including both men and women, or other relevant groups if they are likely to have different priorities.
Tool purpose:
Time needed:
• To identify animal owning communities preferences for sources of credit and the criteria important to determining their priorities • To generate motivation amongst animal owning communities members to form a community savings group to improve access and availability of financial resources to meet their household and animal needs • To compare differences in priorities for sources of credit and the underlying rationales informing different groups’ priorities (e.g. men and women, owners/users/carers)
2 hours
Materials needed:
Chart paper, pens/markers or chalk/coloured dust, stones, pebbles, local materials (leaves, seeds, etc.)
Specific Topics: Livelihoods, Group Formation / Strengthening
Matrix ranking and scoring of sources of credit
In this adaptation of the tool, different sources of credit can be analysed against agreed criteria that group members consider important to deciding which source of credit to use to borrow money. Rather than ranking across each criteria, this example ranked credit sources at the end, to allow participants to provide greater details they felt important to distinguishing between different sources of credit within the matrix itself. This exercise can also be used to motivate community members to form a self-help/savings group if one does not already exist.
T9d Scoring & ranking of different sources of credit
The credit source analysis was carried out with a self-help group in an animal-owning community. Upon completing the chart, the group revealed the following:
Two guarantors are required for credit eligibility from money lenders and banks, whereas only one guarantor is required co-operative societies.
Banks and co-operative societies require land as collateral to be eligible for loans, whereas money lenders do not require land - they accepting jewellery as collateral instead.
Individuals can access interest-free loans from relatives.
Money lenders have the highest interest rate (6%), but can provide loans very quickly.
Banks and co-operative societies have a lower interest rate (3-4%), but the application and approval process takes a long time.
Only loans from self-help groups offer a 1% return of interest, and also offer a relatively low rate of interest (2%) in comparison with money lenders, banks and cooperative societies, as well a quick turnaround for accessing money.
Borrowing credit from money lenders and/or relatives can be high risk/stressful, as they often come with unrealistic timelines and heavy pressure to return money quickly, and are much less forgiving if repayment is late.
Through this exercise, the group realised that the best source of credit would be from a self-help group. This prompted the group to decide to establish a self-help group to start saving money together, so they could begin lending money amongst members to help meet the needs of their animals and families. As a result of establishing a savings groups, group members were able to being quickly accessing low-interest loans with low stress, the only condition for accessing loans from the group was that they had to be an official group member in good standing in terms of meeting the established savings contribution requirements.
Analysis of sources of credit using ranking
Step 1
Start by asking participants to discuss the different sources of credit and what is needed to access those sources. You can initiate the discussion by asking whom they might owe money to now or who they have borrowed from in the past. Draw a matrix either on the ground or on chart paper and list the sources of credit in a column.
Step 2
Have the group discuss the reasons for choosing one source of credit over another. List the criteria considered when selecting a source of credit along the top row of the matrix.
Examples of selection criteria might include:
• Accessibility (ease of access) • Eligibility or collateral required • Interest rate charged • Interest rate returned (from contributions to a savings group) • Availability / timeliness of accessing loans • Loan repayment flexibility (instalments vs one lump sum) • Threat or stress associated paying back the loan
The group can add as many criteria as they feel are relevant. If there are many criteria listed, encourage participants to prioritise the most important ones.
Step 3
Have the group fill in the matrix criteria for each source of credit.
Once identified, assist participants in framing the criteria as either all positive or all negative, which will keep scoring consistent and prevent confusion. For example, criteria related to accessibility may be framed positively as ‘ease of accesses, or negatively as ‘difficult to accesses. Using both positive and negatively framed criteria together e.g. easy to access (+), difficult to access (-) might confuse the ranking or scoring process, by mixing high scores with negative meaning and positive meaning.
Step 4
Upon completion, ask the group to total each row based on the scores that they have assigned each criterion. If a self-help is identified as a credit option, consider ranking the sources of credit in addition to scoring. If a self-help group is not an option, it is not necessary to rank the sources of credit. In this case, it might be an appropriate time to introduce the option of a self-help group.
Then, have the group rank the scores if a self-help group was identified, with the number one (1) having the highest score, number two having the second (2) highest score and so on.
Step 5
Ask the group to draw conclusions from the exercise by asking:
• What are some reasons for needing credit? • Which sources of credit are used most often to meet your needs? Do you use any of these sources of credit to help you meet the needs of your animals as well e.g. to pay for health services, or purchase feed or equipment? If have self-help groups have not been identified as a source of credit, then consider these discussion questions: • Based on the criteria and the results of this exercise, are you satisfied that the sources of credit you currently rely on are the best options to meet your credit needs? • What are the benefits of starting or joining a group like for example self-help group or animal welfare group or saving and credit cooperatives?
Step 6
The matrix should be left with the community and opportunities to learn more about group formation and collective action activities added to a community action plan, which can be addressed later. Take a copy and add it to your project action tracker for future discussions and action planning.
Facilitation Notes
It is very important that the facilitator keep the group focused on the chosen topic, as this exercise has the potential to deviate from the original focus.
Consciously or unconsciously, there may be a tendency for facilitators to include their own criteria, rather than those of the community. Encourage participants to come up with their own criteria and avoid inserting your own ideas. Some criteria may seem strange. If participants consider it important, it needs to be respected and rationale understood.
Depending on the context, at the planning phase consider carrying out this activity separately between men and women or different groups of people (e.g. owners, users, carers) and compare the results. Differences in the roles people play in animals’ lives and/or how they depend on their animals to meet different needs can influence how people prioritize issues and make choices to act. Discuss any differences in their responses and reasons for those differences.
Encourage participants to explore the root causes of welfare issues or challenges prior to planning actions; this will promote the identification of more effective and sustainable solutions. This can be part of discussions at the end of the activity or see next steps for recommended follow-up activities to support root cause analysis.
Criteria should be either all positive or all negative: mixing positive and negative criteria can be confusing.
Facilitators must be clear about the specific topic being examined to keep the group focused.
Next Steps
This activity can be followed by T15 Cost-Benefit Analysis to explore the costs and benefits to people and animals of different solutions to credit sources, including alternative sources, thereby helping to generate motivation to take action.
Use understandings gained about what motivates animal owning communities to inform the design of projects and/or strategies.
This PLA may be conducted to assess change in a variety of contexts, and this tool includes guidance for two different versions, including: a) changing trends analysis, and b) before and now change analysis.
T11a: Changing Trend Analysis
A changing trend analysis helps the community to identify changing trends over time, for example over generations. Here, a ‘generation’ refers to people born and living around the same time e.g. ‘grandparents generation’, ‘parents generation’, ‘present generation’ etc. Through discussion of present and past situations, this tool enables participants to identify the significant changes that have occurred over time, promoting a greater understanding of the current situation.
Tool purpose:
Time needed:
• To reflect on changes to the lives of animals and animal-owning households within a community over time: - animal populations - reliance and use of animals - animal husbandry and management practices - disease patterns - availability and use of health services and resources - climate or other environmental factors • To generate discussion about significant changes over time and reasons for any perceived negative changes that have occurred
2 - 3 hours
Materials needed:
Cards, pens, markers, coloured powder, chalk, sticks, tree leaves, coloured cards or other locally available materials.
Keyword Search Tags
Project Phase: Initiation Phase
Approaches for Working With Communities: Community Development Approach, Community Engagement Approach
Project Support: Participatory Learning and Action Tools
Specific Topics: Animal Husbandry and Management; Animal Welfare, Feelings and Needs; Animal Health and Services; Livelihoods; Vulnerability / Resilience
Changing trend analysis
Figure T11A-1 Changing trend analysis matrix (analysis criteria on vertical axis, generations on horizontal axis)
Figure T11A-2 Changing trend analysis of changes affecting potters and their working animals over four generations
The completed matrix above is the result of a changing trend analysis carried out with a group of animal-owning farmers. It was used as part of a community needs assessment and shared vision. It shows changes in work type and land ownership, quantity, type and cost of animal feed and fodder, grazing land accessibility and availability, average household income and expenditure, availability of and distance to travel for water, human and animal disease prevalence and treatment options, and changing political situation. As a result of this exercise, farmers were able to identify opportunities to mitigate the trends they identified as negatively impacting their lives and the related welfare of their animals.
Changing Trend Analysis
Step 1
Start by explaining that the purpose of the exercise is to understand how the situation in the community has changed over time, and that the group will start with the present and then look at the past. Then ask the group what changes they have experienced in their lives as compared to the past?
Examples:
• Income-generating activities for men and women (separately) • Household income • Household expenditure
Other human aspects, such as food consumption, health and illness, education, and social groups, such as religious groups, self-help & savings/loaning groups, women’s groups. Access & availability of natural resources, such as water, wood, soil, land, etc.
Then ask about changes they have experienced related to their animals.
Examples include:
• Types of animals • Animal work types • Feed practices • Health/illness • Treatment
Ask the community helper to write all identified changes on cards using words or drawings. Make sure that each criterion is specific, for example if participants say ‘water’ clarity if they mean ‘access and availability of water’. Once all changes have been identified, ask participants to select the cards representing the changes which are most important to them. It is the facilitator’s job to ensure that the ones most important to the project are included.
Step 2
Then ask participants to define a timescale for their analysis. It may be based on generations, such as ‘in our grandparents’ time’, ‘in our parents’ time’ and ‘in our time’, or other important activities, events, or years.
Ask the community helper to draw a matrix on the ground and show the chosen time scale on the horizontal axis along the top of the matrix and place the cards with the trend criteria identified in step 1 down the vertical axis (figure T11A-1).
Step 3
Next, explain to the group that they will complete the matrix and decide with the group how they wish to display the situation for each trend criteria. For example, by scoring criteria that can be measured using seeds or stones (0 to 10 for income/expenditure), and/or drawings, symbols, or words for lists of objects etc. As the group defines the scenario for each trend criteria, ask the helper to represent the situation on cards using the chosen means of display.
Step 4
Once the matrix is complete, record the trend analysis by adding a column labelled ‘analyses to the matrix.
Use the following guiding questions to facilitate a discussion about changes over time:
• What are the significant trends or changes that have occurred over time? • Are these trends/changes positive or negative? • What caused these trends/changes to occur?
In the ‘analysis’ column, write whether the change has been positive or negative and have participants expand on the negative changes. Explore the possibility and interest in taking action to address the identified negative changes.
Step 5
The matrix produced should be left with the community. Take a picture or copy and add it to your project action tracker for future reference and to assist with intervention planning.
Facilitator’s Notes: Changing trend analysis
Include a broad cross-section of animal-owning household members of all ages. Invite 10-20 people to participate in this exercise (e.g. youth, adults, elders).
If it is not possible or locally appropriate to do the exercise collectively with both sexes, conduct the exercise separately with men and women. Each may recall different events and changes due to the impacts that resulted in their lives.
Do not lead participants into identifying changes that are not important to them. While asking probing questions, emphasize identifying changes that they perceive to be important. Events or perceived changes should not be included simply because the facilitator inquiries about them.
Clarify any doubts to understand people’s perceptions about changes over time by reaching consensus amongst participants.
Next Steps
As part of a community needs assessment and shared vision, this activity might accompany one or more of the following tools to get a full picture of community dynamics and needs for project planning:
T1 Mapping to understand which resources and services are important to the community.
T2 Mobility Map to understand where people spend most of their time and how long it takes to get places.
T3 Venn Diagram(T3b Social Networking Venn diagram) to identify key individuals, groups and actors perceived to be most important to people and their animals.
T12 Dependency Analysisto understand animal-owning households’ level of dependency on external actors and their implications on resources and services important to ensuring animals’ welfare.
T11b: Before and Now Analysis Changing Trend
The before and now analysis helps the community to identify changes from the beginning to the end of an animal welfare improvement project. This tool may be used to analyse many different aspects of peoples’ lives and the lives of their animals, including changes in people’s reliance/use of animals, animal care practices, animal disease patterns and related impacts on people, availability and use of animal-related health services and resources, climate or other environmental factors affecting animals and people.
Tool purpose:
Time needed:
• To reflect on perceived changes in the lives of animals and animal owning households within the project period • As a learning and reflection tool to assess perceived changes in animal welfare and people’s behaviours as a result of community/project activities • To determine if there are remaining areas of improvement that can be addressed
2 hours
Materials needed:
Cards, pens, markers, coloured powder, chalk, sticks, tree leaves, coloured cards or other locally available materials.
Keyword Search Tags
Project Phase: Exit & Evaluation Phase
Approaches for Working With Communities: Community Development Approach, Community Engagement Approach, Societal Outreach and Campaigns Approach
Behavioural Drivers (COM-B): Motivation
Stages of Behaviour Change: Maintenance Stage
Project Support: Participatory Learning and Action Tools, Monitoring and Evaluation
Specific Topics: Animal Husbandry and Management; Livelihoods; Vulnerability/Resilience
Owners know what to look for when animals being treated by LSP
7
LSP access
Previously free services
Availability better – now have LSP phone numbers
7
Beating
Everyone used to beat their animals
No more beating
6
Figure T11B Before and now results from a group of animal owners in Faisalabad, Pakistan
The matrix in figure 11B was produced by a group of animal-owners at the end of a five year project as part of the community’s self-evaluation. They wanted to determine whether the human and animal welfare changes within their community could be sustained over time without the intervention team. The group compared the situation before the intervention to the present state, analysed what the differences meant and whether they thought that they had the skills, knowledge and tools needed to continue to improve on their own.
The group identified six key areas where change has been observed since the beginning of the animal welfare improvement project: food provision (dietary diversity), water provision (daily increase), local service providers’ skills (improvement), owners’ knowledge of good animal welfare, access to local service providers (LSPs) and beating of animals. After scoring the extent to which the majority of the community had made positive change, the group determined that more work was needed to improve LSP skills, owners’ knowledge of animal welfare, access to LSPs and beating of animals. They added the actions that they would take to the community action plan and set a date for the next meeting to focus on beating, which scored the lowest amongst the positive changes.
Before and Now Analysis
Step 1
Start by explaining to the group that they will be reflecting on changes in the lives of animals and their own community members within the project period, comparing how things were before the project to now.
Step 2
Ask the group about the present situation relating to animals’ care, use and their own livelihood status. Have the group compare the present situation to the past.
Ask:
• What are some of the changes that have resulted since project/community action plan activities were implemented? • How have things changed since the beginning of the project?
As the community comes up with the present situation, have the community helper write the changes with words or symbols on cards.
Examples of change categories might include:
• Men’s/women’s work types • Animals’ usage • Household income, expenditure, credit (group formation) • Land access & usage • Animal and human diseases and treatments • Community dynamics (more cohesion amongst group) • Climate change situation (water/feed storage) • Political situation (changes to laws, by-laws) • Environmental change (infrastructure improvements, increased availability of resources)
Please note: If the community comes up with more than 10 changes, ask participants to select the cards representing the 8-10 changes which are most important to them.
Step 3
Ask the community helper to draw a matrix on the ground or large sheet of chart paper. Label three columns ‘change in project’, ‘before’ and ‘now’. Have the helper place the cards representing the most important changes down the first column under ‘change in project’.
Then, facilitate a discussion on how the present situation has changed since the project started. The past and present situations will be defined by the community through this discussion. As each situation is defined for each of the changes, have the community helper write the results on cards and place the past scenario in the ‘before’ column and the present situation in the ‘now’ column.
Step 4
Have the community helper add a fourth column and label it ‘score’. Ask the community to score out of 10 the proportion of the community who meets the ‘now’ criteria. For example, a score of 10 = everyone has changed; 0 = no change.
Step 5
Once the matrix is complete, discuss the results of the activity with the group.
Follow the discussion by asking:
• Does everyone agree with the results? If yes, why? If no, why not? • What needs to change for everyone to achieve the desired result? - Can you achieve the desired results without our intervention? - If yes, do you feel that you have skills, knowledge, and resources to continue without the intervention team?
If the group determines that not all the project objectives have been met and wish to continue with the project, have the community helper add any identified priorities to the community action plan for later discussion and further planning.
Step 6
The matrix should be documented through photos or recreated on paper. Copies should be made and distributed to the group for their records, future reference and/or action planning. Add a copy to your project action tracker.
Facilitator’s Notes: Before and now analysis
If possible, invite 10-15 people to participate in this exercise.
If it is not possible or locally appropriate to do the exercise collectively with both sexes, consider conducting the exercise separately with men and women. Each may recall different change criteria due to the impacts that resulted in their lives.
Do not lead participants into identifying changes that are not important to them. While asking probing questions, emphasize identifying changes that they perceive to be important. Perceived changes should not be included simply because the facilitator inquiries about them.
Have the community’s original shared vision available for reference during the final discussion.
Next Steps
If the community determines it is satisfied with the changes it has achieved:
Consider using T28 Group Sustainability Mapping tool to help participants in planning to sustain their welfare improvements independently once support from the facilitating organization has ceased.
The facilitating organization may use the qualitative before and now findings of project successes to support project reporting or future funding proposals.
If participants indicate the project activities have not achieved the desired changes, update the community action plan and project action tracker with any new agreed actions. Re-evaluate persistent issues using any or all of the following tools:
T21 Animal Welfare Practice Gap Analysis to identify actions people can take, either individually or collectively, to address gaps in animal husbandry and management to improve animal welfare
This tool analyses the household’s dependency on internal actors e.g., household or community, and external actors for resources and services, such as water, feed and/or grazing land, shelter, financial resources, equipment for working animals (e.g., harnesses, carts), grooming supplies, and services, such as animal health service providers. This exercise may also be adapted to assess dependency in contexts where key stakeholders are comprised of only a single group (e.g., women only).
Tool purpose:
Time needed:
• To increase community awareness of their dependencies on external resources and service provision actors and potential implications for promoting animal welfare. • To motivate participants to take action to reduce unnecessary dependency on external actors and improve their self-sufficiency. Activity discussions can motivate collective action and group formation. • To identify project support required to support animal-owning communities in reducing their dependency on external actors. • To monitor changes in reduced dependency on external actors and improvements in self-reliance, which can serve as a proxy indicator of improved resilience/reducing community vulnerability to vulnerable
2-3 hours
Materials needed:
Chalk, coloured dust, stick, stones, pebbles, cards or paper, pens and any other locally available resources to represent service or resources.
Approaches for Working With Communities: Community Development Approach
Behavioural Drivers (COM-B): Behaviour Change Diagnosis and Planning, Opportunity, Motivation
Project Support: Participatory Learning and Action Tools, Needs Assessment, Monitoring and Evaluation
Specific Topics: Animal Health and Services, Vulnerability / Resilience, Group Formation / Strengthening
Dependency Analysis
An animal-owning community used this activity to explore their dependency on external actors.
Figure T12a Dependency analysis – blank template
Figure T12b Dependency analysis produced by an animal-owning community
The group identified twelve resource and service providers on whom they felt they had an external dependency. After scoring their level of dependency, they discussed the reasons for the dependencies:
Figure T12c Dependency analysis – reasons for external dependencies and challenges
The group identified opportunities for action to improve animal welfare:
The community requested support to learn how to make first aid kits for their animals, so they could stock basic medicines for treatment in their own village.
Women decided to use their collective savings from their self-help group to purchase a grinder to begin making their own grain and thereby decreasing their cost of animal feed.
Through these actions, the group was able to reduce their vulnerability and improve their self-sufficiency.
Dependency Analysis
Planning phase – Community action planning
Step 1
Start by asking the group to think of all the resources and services they use to care for their animals and have the helper write them down.
Step 2
Ask the community helper to draw a large table, either on the ground or on chart paper. There should be three main columns: ‘Resources & services’, ‘external dependency’ and ‘household/internal’ (See figure T12a).
Step 3
Start analysing external dependency versus household/internal control, by asking the question: do you depend on an outside source to be able to provide this resource or service to your animal? Provide examples as necessary, such as shopkeepers to buy equipment and materials, feed/fodder sellers to buy feed/fodder, farriers to trim hooves. Have the group score the listed resources and services using seeds or pebbles out of a total score of 10.
Please note: If a household needed veterinary treatment for an injured animal, the external control might be scored as 6/10, as they are dependent on the veterinarian to provide treatment. If they do not rely on anyone externally (e.g. they produce all the feed & fodder themselves), the external score is 0 and the household/internal score is 10.
Step 4
Ask participants to analyse their dependency on external actors based on the chart they have produced. Ask the community helper to record the responses or note them yourself. The following questions may be used to guide the discussion:
• Why do you depend on external actors for certain resources or services? (If not already identified through the exercise) - If externally dependent actors have not already been identified through discussions, ask participants to identify them. • How can you improve animal welfare by reducing your dependency on external actors? • Are there collective actions that the community could take to reduce external dependency?
Step 5
After this discussion, ask participants what actions they can take towards making these changes. Help the group to qualify short-term (~3 months) versus long-term actions (more than a year). If there is a long list of issues and associated actions, have the group prioritise just one or two to focus on before the next meeting.
Have the helper record the actions and linked activities in the community action plan. Make sure to include who will monitor it and a realistic timeline. Support the community by linking them to any necessary stakeholders.
Implementation phase - Participatory monitoring
Step 6
Repeat steps 1-3 (above) to assess the changes agreed by the community in step 4 within the community action plan, by comparing with the previous activity outputs (step 5).
Initiate a final discussion using the following questions as guidance:
• Why have changes occurred or not? What are the reasons for changes? • How have changes impacted on animal welfare and their own lives?
Comparing the past results to present situation can generate useful discussion about perceived improvements in animal welfare and related benefits to people’s livelihoods and well-being that have resulted from changes.
Facilitation Notes
Decide the group dynamics ahead of time and whether it would be best carried out with men and women (or other subgroups) separately or in a mixed group. This will depend on your rapport with the community, culture and local gender dynamics.
If conducted separately between men and women, consider bringing the two groups back together at the end of the activity to review the results of each chart and resolve any discrepancies if time allows.
An in-depth analysis of dependency on external actors (step 4) can take considerable time, so discuss this in advance with the group in preparation.
Next Steps
Record the community’s short and long-term actions and related activities to your project action tracker. Revisit the activities in the next meeting to monitor their progress and what further support is required.
T10 Gender Control Analysisis a useful tool for exploring the differences in internal control (within the household) between men and women.
T13 Income, Expenditure and Credit Analysis is a useful follow-up tool for analyzing dependency on external actors for financial resources and motivating participants to take collective action to reduce expenditures or increase access to savings and credit through the formation of self-help groups.
This PLA may be conducted to explore the potential benefits, risks and affordability of different practices to enable participants to thoroughly examine the implications of their choices for more informed decision-making. This tool includes step-by-step guidance for three different versions, including:
This tool explores the potential benefits, risks, and affordability of adopting different animal welfare-related practices to both people and their animals, thereby enabling participants to thoroughly examine the implications of their choices for more informed decision making. By promoting understanding of the benefits of changing their behaviours or practices to improve animal welfare, along with the costs and effects of existing practices, this exercise promotes animal welfare improvements by generating motivation and commitment to change, and identifies opportunities for reducing costs through collective action.
Tool purpose:
Time needed:
• To promote understanding of the potential effects/costs and benefits of improving animal welfare practices for both animals and people. • To motivate participants to adopt new practices, either independently or collectively, to improve the welfare of their animals. • To identify ways to reduce costs of adopting new practices to improve animal welfare through collective group action.
2 hours
Materials needed:
Chart paper, index cards or sticky notes, pens/markers, chalk and/or locally available materials
Project Support: Participatory Learning and Action Tools
Specific Topics: Animal Husbandry and Management Practices, Livelihoods, Group Formation / Strengthening
Cost-benefit analysis of animal welfare practices
This exercise facilitates assessment of the costs and benefits of adopting different animal husbandry and management practices such as: feeding and watering, sheltering, humane handling, freedom of movement/no hobbling, allowing animals to socialize together, grooming, using welfare friendly equipment etc.
In the example below, animal-owning participants assessed the costs and benefits of adopting animal welfare practices that were previously identified as gaps during the T21 Animal Welfare Practice Gap Analysis.
T15a Cost-benefit analysis of improved animal welfare practices
The above example was produced by a group of animal-owners in a brick kiln community in Pakistan who identified lack of provision of balanced feed as an animal welfare practice gap.
Through discussions, the group identified the following as key learnings:
A balanced ration can be purchased by spending only Rs 50 more per day individually
Keeping the animal healthy is not only important for the health and wellbeing of the animal, but also for the family
Through discussions, the group identified the following possible solutions:
A few people decided that they would add maize to their regular feed ration
The group agreed to explore purchasing feed in bulk because it will save time and they can purchase it collectively at a reduced cost
Cost-benefit Analysis of Animal Welfare Practices
Step 1
Before undertaking this activity, identify key behaviours necessary for improving animal welfare that have been difficult to change amongst the community. For this exercise, have the community select only one hard to change behaviour for analysis at a time, where low motivation and/or high costs have been identified as hindering adoption.
Step 2
Start by drawing a matrix and write the difficult behaviour selected in step 1 in the top row. Ask a community helper to assist in creating the matrix if time and capacity permits.
Step 3
Start the discussion by asking the group to identify the perceived costs of adopting the practice, in terms of money, time and labour. Allow the community to identify the costs important to them without leading them and have the community helper write the costs on cards using words or symbols and place them in the matrix.
Step 4
Once the costs of adopting the new practice is identified, ask participants to specify the benefits to the animal. After the benefits to the animal are identified, ask participants to identify the benefits to the household and have the community helper write the benefits on cards using words or symbols and place them in the matrix.
Step 5
Once the matrix is complete for adopting the new practice, ask participants to identify the effects/costs on the animal if the new practice is not adopted. After these effects/costs to the animal are identified, ask them to identify any effects/costs on the household. Have the community helper write the effects/costs on cards using words or symbols and place them in the matrix.
Step 6
Once the matrix is complete, review it with participants to assess the costs and benefits of adopting the new practice. The following guiding questions may be used to facilitate the discussion:
• What have you learned from this exercise? • What are possible solutions to reduce the negative impacts to animal welfare and your household, while also mitigating the potential costs to your household of adopting the new practice? (Either at household or group level) • Who needs to do what differently and how often?
Have the community helper document the key learnings and possible solutions from the discussions. Based on the discussion, prompt the group to decide on what actions they wish to take, any support needed and who will monitor. Add them to the community action plan.
Step 7
The matrix should be left with the community. A copy should be made for reference for future discussions and action planning. Add a copy to your project action tracker along with any identified needs for support or actions that need to be taken by the project. Make sure to add identified gaps in knowledge or understanding to your action tracker, as well as any plans to further sensitize animal-owning households in these areas.
Facilitator’s notes: Cost-benefit analysis of animal welfare practices
This tool is best conducted with participants who have already been introduced to concepts of animal welfare, understand animals’ needs and best practices. Consider using any or all of the following tools before undertaking a cost-benefit analysis. T19, T21, and T22 are particularly recommended, as reviewing their findings prior to this activity can help to identify the hard to change behaviours.
Make sure that participants consider more than just the financial costs when deciding whether to adopt any new practices.
It may be useful for professionals, such as vets or community animal health workers, to be present for this activity to advise on the animal welfare implications of any identified solutions. This will promote understanding of costs and benefits to animals and resolve any misconceptions about animal welfare issues and best practices.
Consider using any combination of writing, drawings, symbols or number scoring and/or locally available materials to represent costs and benefits identified to enable participants to understand and discuss the matrix once finalized.
When participants’ are considering the effects on the animal, encourage them to think about the physical, behavioural, mental/emotional state of the animal.
In contexts where male and female household members have different animal-related roles and responsibilities (e.g. ownership, care, use, financial decision making), conduct this activity with all household members who have key roles and responsibilities associated with the specific animal welfare practices being assessed and for which change is desired.
When new practices or behaviours are relatively easy to adopt with little risk or cost (e.g. grooming), it may be possible to assess more than a few behaviours in one session without overwhelming participants.
As changes in existing practices are achieved, and/or new priorities emerge, consider conducting this activity again to generate motivation for change in other animal welfare and management practices.
Next Steps
The following tools are recommended for use as a reflective learning exercise to understand whether any of the originally perceived costs and benefits were realized as a result of changes adopted to practices:
Participants may monitor animal-based welfare indicators to assess changes in animal welfare resulting from their changes in practice. Consider using animal-based welfare indicators developed in the following exercises:
T15b: Cost-Benefit Analysis - Prevention and Treatment of Animal Health Issues
This tool explores the potential benefits, risks, and affordability of preventing and treating animal health issues to both the animal and their owners, users and carers thereby enabling participants to thoroughly examine the implications of their choices for more informed decision making. By promoting understanding of the benefits of changing their behaviours or practices to improve animal welfare, along with the costs of inaction, this exercise can support animal welfare improvements by generating motivation and commitment to change, and identify opportunities for reducing costs through collective action.
Tool purpose:
Time needed:
• Promote understanding of the potential costs and benefits of preventing and/or treating animal health issues and effects of inaction for both animals and people. • To motivate participants to take action, either independently or collectively, to improve the health their animals. • Identify ways to reduce costs of adopting new practices to improve animal health through collective group action.
2-3 hours
Materials needed:
Chart paper, index cards or sticky notes, pens/markers, chalk, stones, pebbles, local materials (leaves, seeds, etc.)
Stages of Behaviour Change: Contemplation, Preparation Stage
Project Support: Participatory Learning and Action Tools
Specific Topics: Animal Health and Services, Livelihoods, Group Formation / Strengthening
Cost-benefit analysis of prevention and treatment of animal health issues
This version of the cost-benefit analysis promotes prevention and treatment of animal diseases or illnesses by assessing the costs and benefits of each to humans and animals, and potential effects if no action is taken. This activity can identify opportunities for collective action to reduce the costs associated with preventing and treating some animal health issues e.g. reduced rate group vaccinations.
In the example below, a cost-benefit analysis was conducted with an animal-owning group when prevention and treatment of animal illnesses were identified as a gaps in their welfare practices using the T21 animal welfare practice gap analysisexercise. The costs and benefits of prevention and treatment were assessed for the two highest priority illnesses previously identified by the community using the T8 pairwise ranking and scoring.
T15b Cost-benefit analysis of preventing and treating tetanus and colic
Cost-benefit analysis of prevention and treatment of animal health issues
Step 1
Before undertaking this activity, identify a priority disease or illness which has been difficult to encourage the community to adopt prevention or treatment measure. Consider reviewing findings from T1c Mapping - disease, T8 pairwise ranking and scoring or T9 matrix ranking and scoring to identify priority illnesses or diseases to analyse with the group. For this exercise, select only one disease to analyse at a time.
Step 2
Start by asking the community helper to draw a matrix and list ‘prevention’ and ‘treatment’ along top of the matrix.
Step 3
Ask participants about the main factors they consider when weighing the costs and benefits of preventing or treating the animal disease/illness being assessed. The group may add as many factors as they feel necessary.
The facilitator may probe the participants to consider the following factors if not initially identified, however factors should only be included which the participants use to inform their decision making:
• Cost of treatment/prevention • Disease/illness frequency • Severity • Prevention/treatment cost • Effectiveness • Loss of work/income due to animal illness (for working animals)
Ask the community helper to list identified factors in the first column of the matrix.
As a facilitator, ensure that the benefits to both animals and people are well represented by adding ‘benefits/effects on animal’ and ‘benefits/effects on household’ to the matrix once participants have identified the factors they consider when deciding whether to take preventative measures for illness/disease being assessed. Facilitate the group to fill in the matrix.
Step 4
Once the matrix is complete, review with participants.
Use the following guiding questions to facilitate the discussion:
• What have you learned from this exercise? • What are the benefits to both animal and household of taking preventative measures rather than seeking treatment? • What are possible solutions for reducing this disease/illness that reduce the costs for households? • Are there opportunities to take collective action to reduce the costs? • What steps would you take to put these solutions into practice?
Based on the discussion, prompt the group to decide on what actions they wish to take, any support needed, responsible parties and add them to the community action plan.
Step 5
The matrix should be documented, either through photos or recreated on paper. Copies should be made and distributed to the group for their records and for reference for future discussions and action planning. Add a copy to your project action tracker along with any identified needs for support or actions that need to be taken by the project.
Facilitator’s Notes: Cost-benefit analysis
As this exercise may take some time to complete, limit the number of assessed diseases/illnesses to the main 2-3 priorities. More can be added as time permits or the activity can be conducted again in the future to assess other illnesses/diseases. This is important to reducing the likelihood that participants’ become overwhelmed and/or demotivated to change as a result of the number of changes they are being asked to consider.
As changes in existing practices are achieved and/or new priorities emerge, consider conducting this activity again to generate motivation for change in other animal welfare and management practices.
This tool is best conducted with participants’ who have already been introduced to concepts of animal welfare, understand animals’ needs and best practices. Consider using any or all of the following tools before undertaking a cost benefit analysis:
In contexts where male and female household members have different animal-related roles and responsibilities (e.g. ownership, care, use, financial decision making), conduct this activity with all household members who have key roles and responsibilities associated with the specific animal welfare practices being assessed, and for which change is desired.
If literacy amongst participants is low, consider filling in the matrix using symbols, drawings, or number scoring rather than written text to represent general concepts (e.g. +/-, ?/?/☹). The facilitator is responsible for asking questions and facilitating discussions about representations in the matrix to promote understanding and engagement of all participants. See example in animal feed cost-benefit analysis.
It is common for participants to start by analysing the financial costs and benefits of alternative animal welfare practices and naturally seek out the cheapest options. Your role as a facilitator is to ensure that animal welfare costs and benefits are included in the discussions, along with their related implications on animal-owning households.
Next Steps
Address any misconceptions or gaps in knowledge or understanding that were added to your project action tracker (plans for additional outreach, trainings, or experiential learning activities to further sensitize animal-owning households within their own action plan).
The following tools are recommended for use as a reflective learning exercise to understand whether any of the originally perceived costs and benefits of action were realized as a result of changes adopted to practices.
Participants may monitor animal-based welfare indicators to assess changes in animal welfare resulting from their changes in practice. Consider using animal-based welfare indicators developed in the following exercises:
This tool explores the potential benefits, risks and affordability of adopting different animal feeding practices to both the animal and their owners, users and carers thereby enabling participants to thoroughly examine the implications of their choices for more informed decision making. By promoting understanding of the benefits of changing their current feeding practices to improve animal welfare, along with the costs of maintaining the current situation, this exercise can support animal welfare improvements by generating motivation and commitment to change, and identify opportunities for reducing costs through collective action.
Tool purpose:
Time needed:
• To promote understanding of the potential costs and benefits of improving animal feeding practices and effects of inaction for both animals and people • To motivate participants to take action, either independently or collectively, to improve the welfare their animals • To identify ways to reduce costs of adopting new feeding practices to improve animal welfare through collective group action.
2-3 hours
Materials needed:
Chart paper, index cards or sticky notes, pens/markers, chalk, stones, pebbles, local materials (leaves, seeds, etc.)
Stages of Behaviour Change: Contemplation, Preparation Stage
Project Support: Participatory Learning and Action Tools
Specific Topics: Animal Husbandry and Management, Group Formation / Strengthening
Feeding practice analysis
In our experience, many working animals are thin and community groups identify feeding as one of their main concerns. Root cause analyses often highlight difficulties in finding enough good quality food of high nutritional value and the high cost is often considered a barrier. The feeding practice analysis explores whether changes in animal feeding practices will lead to better animal welfare outcomes whilst remaining affordable. It can assess current feeding practices, the nutritional content of different feeds and/or general effect on the animal, and the best formulation of feed at low cost. Finally, this tool can identify opportunities to improve the affordability of feeds through collective action.
T15c Cost-benefit analysis of animal feeding practices in Halaba, Ethiopia
Cost-benefit Analysis of Feeding Practices
Step 1
Start by asking participants to discuss different types of feed available throughout the year, not just those which are currently available. Ask the community helper to draw a matrix on the ground or a large piece of chart paper, list the difference types of feed down the first column using words, symbols, pictures, or locally available materials to represent the different feed types.
Step 2
Ask participants to list the factors they consider when weighing the costs and benefits of using the different feeds. The group may add as many factors as they feel necessary.
The facilitator may probe the participants to consider the following factors if not initially identified, however factors should only be included which the participants use to inform their decision making:
• Cost • Availability (seasonal/annual) • Access (ease of obtaining) • Nutritional value for promoting animal health and productivity • Discounts for buying in bulk
Ask the community helper to list identified factors along the top row of the matrix.
Please note: As a facilitator, ensure that the nutritional value for promoting animal health and productivity is included in the matrix if not already identified by participants so that the assessment of costs and benefits of different feed types do not solely consider factors important to households.
Step 3
Facilitate the group to fill in the matrix. Consider using any combination of writing, drawings, symbols, number scoring (e.g. 🙂/😐/☹️, +/-) and/or locally available materials to complete the matrix so participants can understand and discuss it.
Step 4
Review the matrix with participants to assess the costs and benefits associated with changing feeding practices to improve animal welfare.
Use the following guiding questions to facilitate the discussion:
• Which of these feeds do you currently use? • What is the cost of the feed currently being provided (allow participants to specify in terms that are relevant to them e.g. daily/weekly cost)? • Do you think it would be better to use a different formulation of feed than you currently use given each type of feed has a different potential benefit for your animals? • What feeds/formulations would have the highest nutritional content and greatest benefit for animals at lowest cost for households? • Are there opportunities to adopt these improved formulations of feed through collective action/purchase to get a reduced group rate? • What steps would you take to put these solutions into practice?
Based on the discussion, prompt the group to decide on what actions they wish to take, any support needed, and responsible parties, and add them to the community action plan.
Step 5
The matrix should be documented, either through photos or recreated on paper. Copies should be made and distributed to the group for their records and for reference for future discussions and action planning. Add a copy to your project action tracker, along with any identified needs for support or actions that need to be taken by the project.
Step 6
The diagram should be documented through photos or recreated on paper. Copies should be made and distributed to the group for their records, future reference and/or action planning. Add a copy to your project action tracker and note preferred resource and service providers.
Facilitator’s Notes: Cost-benefit analysis
Participants should be sensitized to the nutritional value of different feed types available in their locality and the benefits to promoting animal welfare using easily understood local language. Ideally, this would happen shortly before this activity is conducted.
It is useful for professionals, such as vets or community animal health workers, to be present for this activity to advise on the nutritional content of different feeds to promote understanding and accurate accounting of potential costs and benefits to animals of different feeds and support development of a locally appropriate feeding plan.
Make sure that participants consider more than just the financial costs when deciding whether to change feeding practices. Ensure that planned changes do not reduce household costs at the expense of animal welfare.
This tool is best conducted with participants’ who have already been introduced to concepts of animal welfare, understand animals’ needs and best practices. Consider using any or all of the following tools before undertaking a cost benefit analysis:
In contexts where male and female household members have different animal-related roles and responsibilities (e.g. ownership, care, use, financial decision making), conduct this activity with all household members who have key roles and responsibilities associated with the specific animal welfare practices being assessed, and for which change is desired.
If literacy amongst participants is low, consider filling in the matrix using symbols, drawings, or number scoring rather than written text to represent general concepts (e.g. 🙂/😐/☹️, +/-). The facilitator is responsible for asking questions and facilitating discussions about representations in the matrix to promote understanding and engagement of all participants. See example in animal feed cost-benefit analysis.
It is common for participants to start by analyzing the financial costs and benefits of alternative animal welfare practices and naturally seek out the cheapest options. Your role as a facilitator is to ensure that animal welfare costs and benefits are included in the discussions, along with their related implications on animal-owning households.
Focus on assessing only a few top priority animal welfare practices at a time to reduce the likelihood that participants’ become overwhelmed and/or demotivated to change as a result of the number of changes they are being asked to consider. This is important if the changes are perceived as challenging or high risk to adopt. However, when new practices or behaviours are relatively easy to adopt with little risk or cost (e.g. grooming), it may be possible to assess more than a few without overwhelming participants.
As changes in existing practices are achieved and/or new priorities emerge, consider repeating this activity with other animal welfare and management practices.
Next Steps
Add identified misconceptions or gaps in knowledge/understanding to your project action tracker, along with any of the community’s plans for outreach, trainings or experiential sensitization/learning activities.
Use the following tools as reflective learning exercises to understand whether any of the originally perceived costs and benefits were realized as a result of adopted changes:
Participants may monitor animal-based welfare indicators to assess changes in animal welfare resulting from their changes in practice. Consider using animal-based welfare indicators developed in the following exercises:
Most communities may not know how best to apply the Cost-benefit analysis tool (T15) to motivate groups to improve the welfare of their working animals. The animal welfare snakes, and ladder game provide a fun and entertaining way for the communities to apply the cost benefit analysis tool: The tool is adapted from the traditional ‘snakes and ladders’ game.
Tool purpose:
Time needed:
To engage the interest of participants and increase their collective knowledge about animal management and motivates them to act on poor welfare practices.
2 hours
Materials needed:
Chart paper or a piece of cloth, markers, or other locally available resources, such as cards, photos, bottle tops, leaf’s, stones, etc.
Stages of Behaviour Change: Pre-contemplation Stage, Contemplation Stage
Project Support: Participatory Learning and Action Tools
Specific Topics: Animal Husbandry and Management; Animal Handling; Animal Welfare, Feelings and Needs; Community Change Agents
Figure T16: Illustrated example of original large cloth board of Snakes and ladders game developed by Brooke Egypt, Cairo (2009).
Animal Welfare Snakes and Ladders Game
Step 1
For this game you need to prepare beforehand. The common Snakes and Ladders board game is used for the exercise, either the small size available in the market, or you can make a big version using large sheets of cloth or paper. The game has between 50 and 100 squares in a matrix. Ladders and snakes are drawn or painted on, connecting different squares (see Figure T16b)
To convert the game for animal welfare cost-benefit analysis, two types of information need to be collected before starting:
• Existing animal management or work practices which are positive/good. • Existing animal management or work practices which are negative/bad.
These practices need to be recorded in advance on cards, using words, symbols, or photos. Place one card in the square at the top and bottom of each snake, and one at the top and bottom of each ladder. Snakes are usually associated with cost or loss and ladders with benefit or gain. This cost or loss and benefit or gain can be expressed in both welfare and financial terms. For example, bad hoof care practices can lead to lameness (pain and poor welfare for the animal) as well as three days’ loss of work for the owner, costing them a certain amount of money a day. Alternatively, causes and effects can be put at opposite ends of the snakes and ladders. For example, the card at a snake’s head could show a lame animal, while the one at the tail could show poor hoof care practices (bad quality shoeing or untrimmed feet).
Step 2
Normally six to eight people play the game together using dice. Each participant is represented by a different counter or object (such as a bottle top, leaf, or stone) placed on the first square. Everyone gets a chance to play by rolling the dice in turn. At the beginning somebody must roll a six before the game can start. Then each player moves their counter the same number of squares as he or she rolls on the dice.
Step 3
When a player’s counter lands on a square containing a card or photo, the card is turned and discussed by the players. If a player reaches a square showing the head of a snake, the counter must be moved down to the tail of the snake. When a player reaches a square at the bottom of a ladder, they can climb the ladder to reach the square at the top.
Before moving from a snake’s tail, players must describe a situation that they have experienced which is like the one shown on the card. Encourage the group to discuss this and decide what types of action would turn the cost into a benefit, before moving on to the next player.
Facilitation Notes
Consider using many variations of this game, such as placing question cards about good and bad animal management practices in random squares on the board.
Consider using a large board so that players can walk around it to play.
The game can be used with both adult and children with great success.
Next Steps
The tool can be supplemented with the following tools to determine if there have been any changes in motivation of the community towards improving their animal welfare and the value they place on the animal, as well as their knowledge on how to best take care of the animals:
This tool encourages people to think about how their animal(s) feels based on their experience. By mapping animals’ experiences and associated feelings over time, it allows community members to see the cumulative positive and/or negative impact of these experiences. In this way, the tool can provide insights into how communities perceive their animals’ experiences and understand their feelings and needs.
Tool purpose:
Time needed:
• Generate communities’ understanding of how daily activities affect animals’ feelings contribute to animals’ positive or negative welfare states and impact their quality of life. • Improve communities’ compassion for their animals. • Support communities to identify opportunities for providing positive life experiences of their animals. • Motivate communities to increase the provision and frequency of positive life experiences of their animals, as well as other people in their lives. • Help identify gaps in communities’ understanding of animal welfare and animal sentience which can help inform project activity planning
2-2.5 hours
Materials needed:
Facilitator prompt sheets/visual aids including Balance of Life Experiences scale (refer to the animal welfare learning module for example), Five Domains of animal welfare, pens, and paper (not limited to paper, the facilitator can explore different ways the different communities want to document their information)
Stages of Behaviour Change: Pre-contemplation Stage
Project Support: Participatory Learning and Action Tools, Training
Specific Topics: Animal Husbandry and Management; Animal Handling; Animal Welfare, Feelings and Needs; Animal Health and Services; Compassion/Empathy; Community Change Agents
T18a: A day in the Life of an Animal
“A day in a life of an animal”
Step 1
Form 2-3 small groups of 3-5 people depending on the number of participants. The more groups the longer the activity may take.
Step 2
Ask the groups to think about the animals in their community, and to choose an individual animal that they will explore together. Ask the group for a summary of the individual animal, for example age, name, whether they work. If using pens and paper this animal can be drawn in the middle, or if reporting verbally then the participants can give a quick overview in the introduction to the group in Step 5.
Be prepared to ensure the group focuses on one example (e.g., a horse working in a brick kiln, a chicken providing eggs).
Step 3
Ask each group to draw a clock with 24hrs and briefly describe what the animal is doing over the course of the day (e.g., waking up, eating/drinking, being prepared for work, working, resting) and map these on the 24 clocks. Check to ensure all key periods and activities have been included, asking probing questions if you think anything may be missing.
Step 4
Then ask each group to pick at least 3 time points throughout the day (recommended to choose at least as many time points as people in their group), and consider in more detail what the animal is experiencing at each of these time points including: • What activities are/ is the animal doing/engaged in (e.g., feeding)?
Prompt the group to think in terms of the five domains. Often people will focus on tangible things like food and water. Try to also ensure that other activities are also covered, for example free time, rest, social contact. Refer to the five domains of animal welfare visual aid if available to support their discussion.
• What are the frequency and duration of these activities/experiences? • How does each activity/experience make the animal feel (e.g., experiencing pleasurable tastes) and influence the animal’s mental state?
Some people find it easier to reflect on how they would feel in that situation. So, for example discussing quality rest – you could ask, “how do you feel when you don’t sleep well? Can you sleep when it is very noisy around? Has anyone ever been prevented from sleeping because they were worried about something (that was going to happen to them the next day)?”
Step 5
Next, bring the groups together and ask them to give a short introduction to their chosen animal’s day to the whole group. Each person in the group can present at least one time point so that between them they cover the full day.
Next, facilitate a discussion using the points below as a discussion guide: • Probe for more details on their animals’ daily experiences/activities where appropriate and needed to encourage them to think about and identify the nature of these experiences in terms of whether they may be positive or negative where this may not yet be clear.
For example, with rest, can the animals move freely? Are they restrained up next to someone or something they don’t like or fear? Are they restrained so that they cannot relax properly and achieve good quality rest? Is the environment noisy, preventing them from sleeping? How do their rest patterns align with their natural needs?
• Discuss whether an activity and/or experience is truly positive or whether it reflects an alleviation of a negative experience. For example, providing water to a dehydrated animal is alleviating a negative experience, whereas play is (most likely) a positive experience. - As negative and positive experiences are not always the direct opposite of each other, it is important to discuss them separately e.g., is the experience negative or not; is the experience positive or not.
• Encourage discussion of how the frequency, duration, and intensity of experiences differ, and how this can impact an animal’s quality of life.
For example, if an animal is wounded in an accident, this may be a very intense experience and painful at the time. However, if the animal is in a secure environment and receives prompt and effective treatment, then the negative experience will be lasting. However, if the animal does not receive treatment, then the negative experience will last longer. Even if the injury is minor and the pain experienced is not initially intense, if left untreated the pain will increase, and the animal may need to be active or work with the painful injury or be unable to rest properly if in pain. These experiences will accumulate, making the overall balance of these experiences will be negative, and lower the animals’ resilience to other negative experiences. In this example, a short but high intensity experience may have less impact on the balance of experiences than a less intense but longer lasting experience.
• Ask what opportunities are provided for their animal to experience comfort, pleasure, interest, confidence, and the ability to make choices and feel a sense of being in control? - For example, if they are provided with shelter, do they have the choice about when to enter the shelter and when to remain outside, allowing them to adjust for their thermal comfort and security (e.g., some animals, such as horses, may feel very trapped in a shelter, whereas other animals, such as dogs, may feel a lot safer within a shelter than outside).
• Based on this discussion, where do you believe your animal sits on the balance of life experiences scale and why? (Refer to the balance of life experience visual aid if available)
Once concluded, summarize their discussion in terms of the following points: • Key points in the animal’s day (e.g., rest, work, eat, drink, are tied up (movement restricted), roam freely). • The range of their animals’ experiences and feelings. • How animals’ feelings would change if experiences were very frequent or very prolonged. • Highlight where the animal sits on the balance of life experiences scale and why.
Step 6
Next use the following questions to encourage participants to reflect and learn from the activity:
• Was there anything that surprised you? • What did you learn from this activity? • How representative do you think this is of your other animals/animal in the community? • Is there anything that you think you could do differently in the future to improve your animal’s quality of life based on your learnings from this activity?
Encourage them to identify and/or draw attention to the positive aspects of what they already do as a means to promote reflection and learning and motivation to do more of what is already feasible for them, rather than focusing on what they can’t.
Step 7
Finally, draw the activity to a conclusion using the following points: • Reflect on the original aims and purpose of the activity and draw conclusions relevant to these • Highlight key reflections about what participants learned doing this activity. • Summarize what the group concluded they could do to minimise negative experiences and/or increase positive experiences in their animals’ lives.
T18b: The Life of an Animal
The life of an animal
Step 1
If doing this exercise in a separate session from the day in a life activity, begin with Step 1 and 2 from the “A day in the Life of an Animal” activity above first.
If conducting this activity in the same session following completion of the day in the life activity, skip to step 2 below.
Step 2
Explain they will be mapping their animal’s experiences over the course of the animal’s lifetime and ask them to decide how they wish to represent the lifetime of their animal’s life cycle visually e.g., table, circle, list, timeline.
Then ask each group to identify the major life cycles/stages/time points of their animal, and plot these in accordance with how they decided to represent the animal’s lifetime. Encourage them to identify at least as many life events as people in their group, ensuring they include consideration of the animal’s life cycle from birth, growth, reproduction, working up to end of life as well.
Step 3
Once the life stages/time points of their animal are identified in step 2, ask each group to explore in more detail what the animal is experiencing at each stage, you can use the following to guide the discussions:
• What activities are some of the activities the animal is doing/engaged in at each stage (e.g., working, breeding)?
Prompt the group to think in terms of the five domains for the life cycle/stage of the animal they have picked to focus on. Often people will focus on tangible things like food and water. Try to also ensure that other activities are also covered, for example free time, rest, social contact. Refer to the five domains of animal welfare visual aid if available to support their discussion. • What are the frequency and duration of these activities/experiences? • How does each activity/experience make the animal feel (e.g., experiencing pleasurable tastes, experiencing positive human-animal interactions, experiencing and exhibiting positive natural behaviours, etc.) and influence the animal’s mental state?
Some people find it easier to reflect on how they would feel in that situation. So, for example discussing quality rest – you could ask, “how do you feel when you don’t sleep well? Can you sleep when it is very noisy around? Has anyone ever been prevented from sleeping because they were worried about something (that was going to happen to them the next day)?”
Explore the different life stages in more detail considering what the animal is experiencing at each stage. Details to be discussed should consider both the activity (e.g., weaning) and the associated mental state (e.g., distress/fear/panic if forcibly weaned and put in isolation). • What are the frequency and duration of these life experiences? • How does each experience make the animal feel (e.g., experiencing pleasurable tastes, experiencing positive human-animal interactions, experiencing and exhibiting positive natural behaviours, etc.) and influence the animal’s mental state?
Some people find it easier to reflect on how they would feel in that situation. So, for example discussing being separated from other animals and kept alone – you could ask, “how do you feel when you are isolated from friends and family? Has anyone ever been prevented from socializing with your network of support?”
Step 4
After discussion, bring the groups together and ask them to present the lifetime of their animals to the whole group. Each person in the groups should present at least one time point/life stage, which between them covers the entire lifespan. Encourage discussion of how the animal’s welfare changes over their lifetime using the guiding questions below, and encourage a process of reflecting on the exercise, generalising, and application. Conclude where this animal sits on the Balance of Life Experiences chart.
Step 5
Once finished, summarize key reflections and learnings from discussions including:
• Key points in the animal’s life (e.g., birth, early life, weaning, working/productive life, ownership changes, end of life). • The range of experiences and feelings, and how these change over time. • How quality of life is impacted by experiences that are very frequent or very long. key reflections and what people discovered by participating in this exercise. • What the group concluded they could do to minimise negative and add more positive experiences, including any immediate actions vs longer term changes needed.
Conclude by reflecting on the original aims and purpose of the exercise and draw conclusions relevant to these, and ensure concluding reflections highlight where the animal sits on the balance of life experiences scale and why.
Facilitator's Notes
Preparatory work (things to consider before the exercise):
It is important that participants have been socialized in the concepts of the five domains of animal welfare and balance of quality life experiences prior to beginning this activity. If they have not yet had an introduction to these concepts, you will need to build in more time to introduce these concepts in advance.
Consider your target audience (community, community facilitators) for this exercise.
Establish your motivations and goals for doing this exercise with that group of participants.
Based on this, decide whether you will run both activities and only run one of the activities.
Establish what species/animals are you are likely to, or need to, discuss and why (consider whether there is benefit of having same species groups e.g., equid owners).
Do you feel confident with the application of this task to those species? Do you feel confident discussing the range of positive and negative experiences for the different animal species that you may be discussing during the exercise? Do you need to seek some further support or clarification?
Consider a manageable group size (too small may produce too little discussion, too big may result in too much variation, debate, or not enabling everyone to participate fully).
Be prepared with information to respond to how a community views the animal experiences. We suggest that in advance of the session you have a list of ‘red flags’ – practices that are very dangerous to welfare and need an immediate response – and an idea of what the ideal situation would look like, so that you are clear on what you can praise/want to see.
Consider how you may capture these results with literate and illiterate groups (use photo to capture if they have used different symbols to represent the life of an animal)
In this tool it is important to focus on increasing opportunities for positive experiences, and not only opportunities for reducing negative experiences.
for “The life of an animal” activity, the following suggestions also apply:
Consider how the community/culture would most likely break down the life of an animal e.g., by age, by life event, and work with them to establish the best way of doing this. Ensure that all the critical stages/life cycles from birth to end of life are captured in the discussion even though the classification might vary.
Be prepared to challenge or fill in gaps of key life stages that may be missed.
Next Steps
This exercise may be used to improve communities understanding of how experiences can impact on an animal, promote understanding of the concept of animal welfare generally, and/or as a precursor to community action planning by helping to generate discussion and ideas about how community members can provide more opportunities for their animals to have more positive life experiences and a greater sense of control choice and feeling of control. Next steps will therefore vary depending on your intended objectives of use of this tool, and in what project phase you are implementing it. Think about how the information or outcomes generated from this activity may be used or help inform your next steps. You may also wish to consider whether they can serve as an indicator of change which you may wish to assess again later. (Although if this uncovers incidents of welfare practices that are unacceptable then the facilitators should explore using the available resources within this guide how to address them).
The tool supports discussions with community members about their animals’ welfare needs, the challenges they have in meeting them, and potential actions that may improve their animals’ welfare.
The tool enables the community to identify specific animal welfare issues, and the constraints they may experience when addressing these. Animal welfare issues are ranked in terms of their importance, to enable the community to decide on actions to be taken to address them. This tool builds upon initial discussions introducing animal welfare, which can be facilitated by tools such as the T32 Community Animal Welfare Conversation Tool and T5 Gender Roles and Responsibilities. The tools is also a precursor to community animal welfare action planning (T34) tool as it provides the platform/ a pathway to planning to take action to improve animal welfare.
Tool purpose:
Time needed:
• To identify resource constraints influencing the welfare of their animals, the issues it causes, and how this affects both animal welfare and households. • To help with prioritizing the most important issues affecting animals and households in terms of severity and frequency, disaggregated by gender. • To understand the similarities and differences in gender perceptions of priority welfare issues. • To Promote understanding of the animal welfare domains.
2 hours
Materials needed:
Different counters, e.g., beans and corn, graphic of animal welfare needs (e.g., T32b/or five domains of welfare graphic, flip chart or clear ground, marker pens.
Specific Topics: Animal Husbandry and Management; Animal Handling; Animal Welfare, Feelings and Needs; Animal Health and Services; Community Change Agents
An example is provided below of a sample of community identified responsibilities related to animal welfare (Table T33a) and an example of community prioritization ranking (Table T33 b).If you have done T5 Gender Roles and Responsibilities, T8 Pairwise Ranking and Scoring or T9 Matrix Ranking and Scoring, you can also remind the community participants to the findings of the discussions and the priorities identified by them provided they want to continue to work on those priorities.
Animal Welfare Need
Who is responsible for meeting the need
Comments
Adult Men
Adult Women
Young Men
Young Women
Feed and Water
○○
○○○
○○○
○○
Adult women and young do most of the feeding responsibility
Providing Shelter
○○○
○○
○○
○○
Adult men are mostly responsible for providing Water
Wound care and seeking medical services
○○
○○○
○○
○○
Adult women do most wound care related issues
Allow the animals to be free and express their natural behaviour
○○
○○○
○○
○○
Adult women tend to be responsible for taking care of behavioural issues
Table T33a. Example of animal welfare needs and who is responsible for meeting them
Welfare issue
Men
Women
Comments /reasons
Feed shortage
○○○○○○
○○○○○○
Water shortage
○○○○○
○○○○○
Lack of veterinary services
○○○○
○○○
Poor shelter
○○
○
Diseases
○○○
○○○○○
Table T33 b. Example Animal Welfare Issue Prioritization Ranking
Community Animal Welfare Needs Analysis
Step 1
Explain the purpose of the activity is to discuss the needs of participants’ animals, the challenges they face in meeting their animals’ needs, and who in their households is responsible to meeting these challenges/animal needs. Depending on the number of equine participants in the meeting, divide them into sub groups of 3-4 and have them discuss at least the priority 3 animal needs that have been identified and share the discussions in plenary. This should allow the rest of the participants to input into the presentations of the smaller sub groups.
Begin by asking participants: ‘What problems do your animals experience?’ Probe further to ask why this is a problem for them and their animals. If the challenges identified are many, let the community members prioritize the most common animal need by the community. Pick this to discuss the following discussions.
Examples of probing questions could include:
• Does the problem cause their animals to stop working? • Does the problem take a long time for their animals to recover from? • Could this problem cause their animals to die? • Does this problem change their animals' behaviour? • Is the problem challenging or expensive to manage, or do they find it unpleasant?
Step 2
Then, ask participants, ‘Who in your household cares for your animals’ needs?’
Draw a matrix, and list all given household members along the top row, or if conducting this activity with a large group instead of a household, list categories of household members e.g. women, youth, men etc.
Next, ask participants ‘What do your animals need to be happy and healthy?’
Encourage them to consider their animals’ needs in terms of their health, nutrition, environment, and behaviour. List their ideas in the matrix in the first column.
Then ask: 'Who in your household is responsible for meeting these animals’ welfare needs?’
Encourage responses from both men, women, and youth (see facilitator notes below on who to conduct this session with). Explain that to see how much each household member contributes to meeting the households’ animal welfare needs, you will use scores. Use different counters to represent men's, women’s, and youth's scoring. For example:
• A score of 3 means most of the time. • A score of 2 means sometimes. • A score of 1 means occasionally. • A score of O means not at all.
Refer to the table T33a above for an example of how this can be done.
Step 3
Ask participants:
'How well do you think you're meeting the needs of your animals right now?'
Ask for a show of hands to demonstrate ’poor’, ‘OK’ and ‘very well’. Ask a few men, women, and youth participants to give examples of good animal welfare actions that they have undertaken.
Record responses on a flip chart. Probe further and encourage a discussion around what good and poor animal welfare examples they see in the community. Find out differences among the participants.
Step 4
Then, ask participants:
'What is preventing you from meeting your animal's needs?'
Invite men, women, and youth to share their challenges in meeting the needs of their animals. Write responses on a flip chart. Possible responses could include resource limitations, lack of awareness, attitudes about animal welfare etc.
Encourage a focus on good handling, feed, water, and wound care if needed.
Step 5
Extend the discussion further to specifically cover the issues and constraints participants face in the areas of:
• Health/disease • Feed/Water • Footcare and lameness • Shelter and shade • Wound care and injuries (E.g. from tethering, etc.) • Harnessing, compassionate handling and training • Veterinary services and euthanasia • Time/need, etc.
Capture the commonly given issues and constraints within each of these themes. As issues of nutrition, water access and wound care come up, share extra information with the group as needed.
Step 6
From the discussion, create a list of the commonly given animal welfare issues and constraints, and collate these into their overarching topics/categories such as health, feed/water, shelter/housing, wound care, handling etc. You will use this list to help the community to prioritize their welfare issues. The example provided in T33b above illustrates what this may look like. To conduct the prioritization, divide the participants into groups of men and women. Explain and demonstrate the ranking exercise before starting, and ask participants if they have any questions. Follow the steps below:
• On clear ground or on a flip chart, draw a matrix with the common animal welfare issues topics/categories identified during the previous discussion written on the vertical axis. • Community members in the meeting must agree on a maximum of seven issues – ensure that both men and women have participated in this discussion and agreement. • Write ‘men’ and ‘women’ on the horizontal axis, as indicated in the example T33b above. • Split men and women into two groups and give each group 20 counters. Ask each group to distribute the counters across the issues. The group should agree on the relative importance of each animal welfare issue, and allocate counters to the issues to represent this importance. • When each group has given their scores, probe for reasons for the highest scores and the lowest scores. Take note of the groups' justifications for their scoring. Probe if their prioritization is affected by resources or seasonality. • This tool will reveal similarities and differences in gender perceptions of priority welfare issues.
Step 7
Discuss the importance and relevance of the issues prioritized. Some issues may not be identified by participants as the most serious, but they are likely to affect a very high number of animals, are relatively easy to manage and will affect both welfare and productivity. However, ask about the scenario in this village as resources or seasonality may affect how common or severe these issues are and how they can be addressed. Make sure to reflect back if such factors were not considered so that they are considered in the ranking activity.
Discussion questions:
• Which issues affect the most animals/are most common? • Which issues are the most severe (not necessarily for the greatest number of animals, but which conditions cause the most suffering)? For example, disease outbreak may cause mortality in a per cent of the herd, but undernutrition may affect more animals for a longer period. In this scenario, disease outbreak may be uncommon but severe, whereas undernutrition may be more common but less severe.
From the ranking exercise, encourage a discussion about important welfare issues that cause suffering for animals. This will invite a discussion amongst community members which can help motivate and inform their development of action plans to improve the welfare of their animals (e.g., using T34 Community Animal Welfare Action Planning).
Step 8
Finally, record the community discussions on the prioritization and the justification given along the different gender perspectives into the actions plan into your project action tracker, and support the community by supporting them to develop action plans using T34 Community Animal Welfare Action Planning to linking them to any necessary stakeholders.
During this session, reinforce the learning points of prior conversations on animal welfare e.g., T32 Animal Welfare Conversations Tool, Be sure to ask questions and prompt for the impact the issues have on an animal's behaviour or their feelings.
Provided you have the time to frequently meet with the community groups or households, once they have identified and prioritized issues, you can do step 4 to 8 for different issues in subsequent meetings. E.g. if you have done the first meeting on Health/disease focused issues provided it is prioritized by community members or households, then you can follow up with the second prioritized issue in another meeting
It is important that this conversation is presented in a way that encourages and supports community members to improve their animals’ welfare, but not solve all problems at once. To accomplish this, focus on activities that community members are doing well, highlighting positive examples of animal welfare that they gave. Ask probing questions when these are identified e.g. How common are these to the community? If it is not common, how easy would it be for more community members to adopt activities that have resulted in better animal welfare?
Ideally, conduct this activity at the household level, and with men, women, and youth present – as they may have different roles, perspectives and priorities which it is important to capture. If it is not possible to conduct this activity at the household level, you may wish to consider conducting the exercise with separate groups of men, women, and youth, as they may influence each other’s responses if the activity is conducted as a large community group. If you are conducting this at a group level, ensure that you have divided the large group into smaller groups to enable everyone contribute to the discussion. If not possible to do together as a group or household, then consider doing it separately at different time convenient to respective groups.
Next Steps
Continue to build on these discussions and support community members to address identified priority animal welfare issues by conducting community action planning using the T34 Community Animal Welfare Action Planning tool.
This community action planning tool supports communities in developing actions to address their priority animal welfare issues and has been adapted from Community conversation on animal welfare: A guide to facilitators [71]. This tool can be informed by outcomes from other tools such as:
Once animal welfare issues are prioritised, this tool can be used to facilitate discussions with community members to identify strategies and actions to address priority animal welfare issues, and help them identify knowledge, skills, and/or resource they required to enable them to take action to improve their animals’ welfare.
Tool purpose:
Time needed:
• Support community to reflect on their identified priority animals’ welfare issues and identify actions they can take to address them. • Identify the knowledge, skills and resources communities need to take action to improve their animals’ welfare.
1.5 hours
Materials needed:
Chart paper, note cards, markers, or other locally available resources, pre-printed pictures, or visual aids of priority animal welfare issues (optional), pre-printed pictures or visual aids on improved animal welfare practices relevant to identified animal welfare issues (optional).
Approaches for Working With Communities: Community Engagement Approach; Community Development Approach
Stages of Change: Preparation Stage, Action Stage
Project Support: Participatory Learning and Action Tools, Documentation and Reporting
Specific Topics: Animal Husbandry and Management; Animal Handling; Animal Welfare, Feelings and Needs; Animal Health and Services Community Change Agents
Community Animal Welfare Action Plan
Table T34 below shows an example of a community welfare action plan developed to address priority animal welfare issues identified through discussions using T33: Community Animal Welfare Needs Analysis.
Priority Animal Welfare Issues
Actions to be Taken (Household and / or community level)
ExpectedChanges /Indicators of Success
Resources / Support Required to implement planned actions
Who Monitors / When?
Feed shortage
Community grow fodder for donkeys
Owners then feed the donkeys the recommended portions as needed throughout the day (as donkeys do not feed a lot at once)
Improved donkey health indicators: • Increased feed volume available • Feed available in all seasons • Improved body score condition • Happy and productive animals
Fodder production requires seeds.
Training on fodder production and storage
Improved understanding of donkey feeding best practices e.g. what types of feed, when/frequency of feeding, and how much to feed
Owners do the monitoring monthly
Animal welfare team assessing body score condition quarterly
No access to veterinary services (for preventative treatment and prevention)
Community mobilization based on scheduled vaccination/ deworming programs.
Owners supported by each other to seek veterinary services whenever their donkeys are sick.
Owners vaccinate donkeys on recommended schedule
Improved Health Indicators: • Reduced incidence of donkey’s sickness • Reduced time lost by owners due to animals being unable to work
Animal health providers have access to vaccinations.
Information on how to identify illness in donkeys and when they should not be worked
Owners assessing how their animal is feeling if it is sick or not daily, while ensuring that the animals are vaccinated yearly
Donkeys have access to water
Owners provide their donkeys with water at regular intervals during the day
Improved donkeys’ health indicators: • Improve body score condition/ health • Improve hydration
Access to safe drinking water for donkeys
Daily monitoring of donkeys status, if its thirsty or okay by the owners.
Table T34a: Example of Completed Community Animal Welfare Action Plan
Work with the community to rank 2-3 of the most important issues one by one. T8 Pairwise Ranking and Scoringor T9 Matrix Ranking and Scoring can be used to support identification of priorities, or results from these activities may be used if previously conducted.
You can prompt the discussion with prep-prepared outreach materials if you have developed them to discuss possible actions for improvement and benefits of acting. An example is provided in figure T34(a) of how to go about manging wounds that you can refer to develop any other animal welfare issues you need to help the community to plan to address (refer to the steps for cleaning wounds in figure T34a as an example).
Step 2
Hand out the pre-prepared outreach materials (pictures or illustrations), illustrating the selected priority animal welfare issues, and ask community members to discuss them. Ask: what do you think about and what feelings do you have when you think about taking steps to improving these animal welfare issues? If communities struggle to answer this, you can use the steps below to prompt this conversation if helpful:
• Step 1 - Observe: Look at the animal shown and identify the welfare issue it is facing. (For example, the image illustrates an animal with wounds.) • Step 2 – Question: Ask yourself, what could an animal in that condition be feeling or experiencing? (E.g. Anxiety, confusion, struggle, pain, distress.) • Step 3 – Reflect: What do you think needs to be done to address the animal welfare issue shown? Do you currently have all the things you need to address the welfare issue? Do you need assistance in sourcing something to help address this animal welfare issue from somewhere else? • Step 4 – Discuss action: What could you try doing to address this animal welfare issue? (Such as cleaning the wounds using the available material within the household, such as salt and water). If these actions turn out to be successful – great. If they don’t – you will reflect and adjust the plan.
If you have prepared outreach materials on solutions to the animal welfare issues in advance, hand them out and discuss them for consideration (refer to the example on Figure T34a on wound management).
Step 3
Ask community members to share what they would do to manage the wound issues in step one in their animals. Or you can remind participants of the first prioritised animal welfare issue from the ranking exercise the community previously completed duringT33: Community Animal Welfare Needs Analysis .
Ask community members to share what they could do to address/respond to this priority animal welfare issue. Probing questions to guide this conversation include:
• Is there someone in the community who already responds to this animal welfare issue well? What do they do, to do this well? • What can be done at the household and community level to respond to this animal welfare issue? • What are the challenges that people face to solve this issue? • What are the benefits of acting on this animal welfare issue? • What are the potential costs or constraints to acting on this animal welfare issue?
Make notes of responses onto flipchart paper. Repeat Step 3 for each of the priority animal welfare issues previously identified by the community
Step 4
Use community reflections from Step 3 as prompts to facilitate completion of a community animal welfare action plan. Facilitate a discussion to identify the following key elements:
• Which prioritised animal welfare issues are community members committed to addressing at this point in time? (Not every animal welfare issue needs to make it onto the community action plan, if community members are not committed to addressing it yet). • What are the actions they realistically commit to taking (at both household and community level) to respond to the selected animal welfare issues? • What are the expected changes (indicators of success) that the community would like to see from their actions? • What resources and support do they require to implement these actions? • How/who will monitor whether these actions have been taken and when?
Document the plan into the community animal welfare action plan table (see example in Table T34a). Ensure that the community are left with copies of the plan in a language/format appropriate and requested by them. Finally, record the community discussions and their agreed actions into your Project Action Tracker
Facilitator's Notes
Ensure that as a minimum the following key elements of a community animal welfare plan are agreed by the community during this exercise, using participatory and gender aware facilitation:
What are the priority animal welfare issues community members are committed to addressing? E.g. some priority issues might have been identified, but there isn’t true commitment from the community yet for addressing these.
What are the actions that participants can realistically commit to taking (at both household level and community/group level) to address selected priority issues?
What are the expected changes/indicators of success of their actions?
What resources and support to they require to implement these actions?
How/who will monitor whether these actions have been taken and when? Be realistic.
Communities will likely require further support and input from you/other organisations in order to implement their action plans. It is vitally important that during the community action planning session you are clear with community participants about what it is realistic and appropriate for you and other organisations to provide, and that you ensure these provisions are sustainable. If a request doesn’t fit these requirements, explain this to the participants and help them to develop a more suitable request.
Next Steps
To support community members in implementing their action plans, it will be important to resources and support identified by community members as needed to implement their action plan are secured, and you may need to consider holding meetings with other relevant stakeholder e.g., local government officials, animal health and resource providers to secure their support as needed.
![Figure 21: Visualizing the concept of One Health [12]](http://communitiesforanimals.thebrooke.org/wp-content/uploads/2021/04/A12-OneHealth-Complete-400x374.png)