QUICK LINKS
T6 Seasonal calendar resources and services
Seasonal calendar of the lives of animals, their owners, users and carers
T6 Facilitator's NOTES
T6 NEXT STEPS
T6: Seasonal Calendar Resources and Services
A seasonal calendar is used to plot changes over the annual cycle. This tool provides a visual representation of seasonally varying phenomenon, such as production activities, illness and disease, migration patterns and much more [48]. This is a useful exercise to carry out with a community as part of a needs assessment and shared vision, which identifies mitigating action. This tool enables people to analyse changes across seasons in the lives of animals as well as their owners, users and/or carers, as well as how these changes may be linked to each other.
| Tool purpose: | Time needed: |
| • To identify periods of availability and scarcity (water, food, income) to target programme activities • To identify periods of lowest and highest risk (disease, poor health, poor body condition) to target programme activities • To identify potential linkages or causal factors related to the livelihoods of animals’ owners, users and carers | 1.5 - 2 hours |
| Materials needed: | |
| Chart paper and markers or sticks, stones, straw, leaves, beans, seeds, pulses, coloured sand or chalk powder and/or any other locally available materials to represent each aspect in the chart |
Keyword Search Tags
Project Phase:
Initiation Phase
Approaches for Working With Communities:
Community Development Approach, Community Engagement Approach
Behavioural Drivers (COM-B):
Opportunity
Project Support:
Participatory Learning and Action Tools, Needs Assessment
Specific Topics:
Animal Health and Services; Livelihoods; Vulnerability/Resilience, Animal Welfare, Feelings, and Needs
Seasonal calendar of the lives of animals, their owners, users and carers
The seasonal calendar can include many aspects of life. For example, it may highlight changes in animal welfare according to seasonal variations in workloads or availability of feed, which may also be associated with changes in household income and/or expenditure. It can help the community to decide actions to improve animal welfare and plan ahead to prevent welfare from getting worse in difficult seasons, as well plan alternative livelihood strategies for times when their working animals will not be required, required less or for different purposes. Each important aspect is identified and defined by the community.
Different criteria is agreed by the community to illustrate seasonal variations in:
- festivals, religious ceremonies, important local events
- household income
- household expenditures
- consumption of animal feed and fodder, grazing or other resources
- seasonal prevalence or incidence of animal diseases
- general health status of people in animal-owning households
- the general body condition or welfare status of animals
- availability of water and/or other important natural resources
- availability of work or employment and other livelihood related activities
- work load of animals and humans e.g. periods of heavy work or periods of relative ease
- migration patterns of animal-owning families
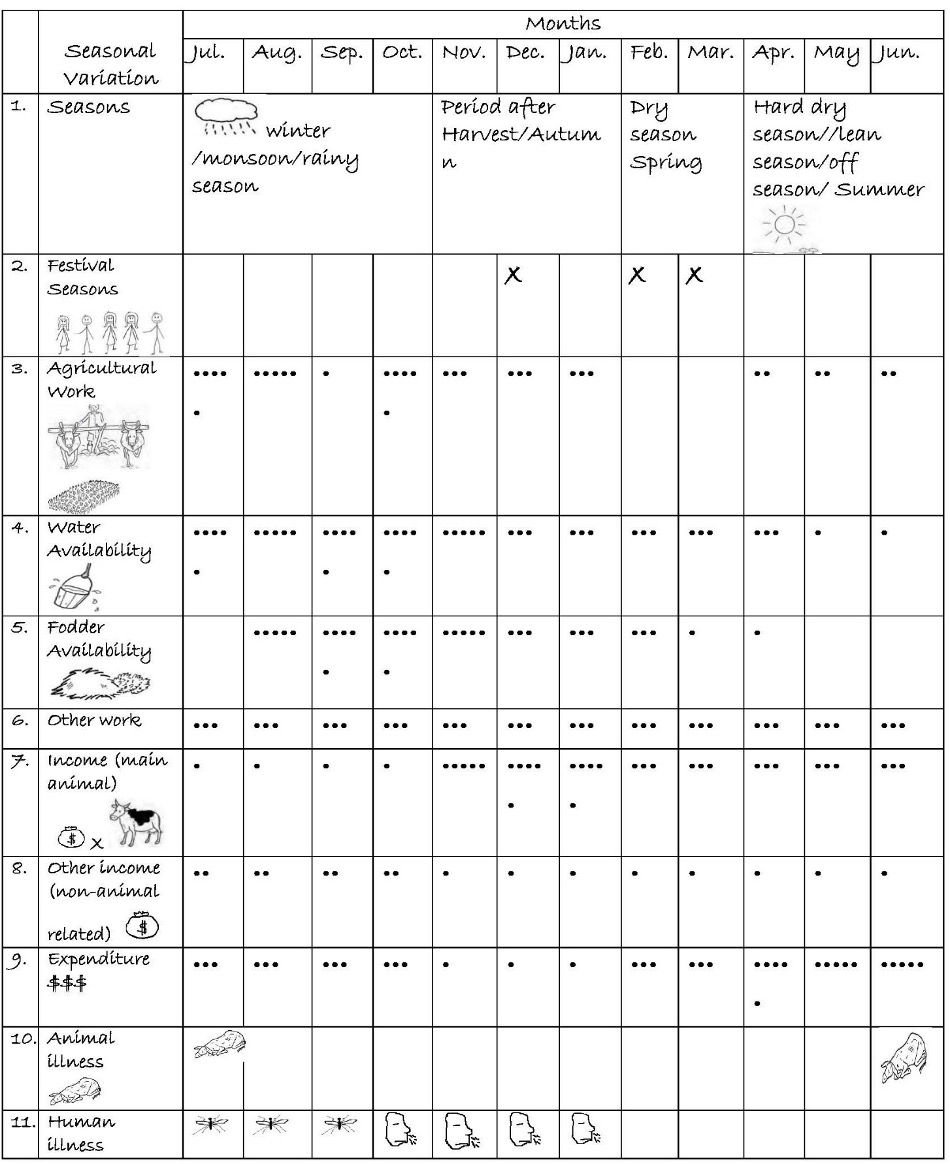
Figure T6 Seasonal calendar created by a group of animal owners in Thies, Senegal
The example above was conducted with a community, whose livelihoods depend on animals, especially during periods of agricultural harvest. Men and women primarily rely on animals to support their livelihoods, but have additional sources of income throughout the year. From this calendar, we come to understand:
- There are four seasons: Winter/Rainy or Monsoon season, Autumn/Harvest time, Spring/Dry Season, and Summer/Lean Season (1st row)
- Two major festivals take place (2nd row) in December and January/February
- Water (4th row), harvesting (3rd row) and fodder availability (5th row) are extremely low or non-existent during the dry season (Aug-Sept) and highest during the rainy season (Oct-Dec).
- Animal-related (7th row) and non-animal related (8th row) income varies between men and women, with women bringing in more non-animal-related income (8th row) throughout the year and men bringing in more animal-related income (7th row) generally.
- Both income (7th & 8th rows) and household expenditure (9th row) go up during festival months.
- There appears to be a relationship between animal body condition (10th row), availability of feed/fodder (5th row) and disease prevalence in animals (9th row):
- Animal body condition is worse and disease prevalence (9th row) higher during summer season (Jun - July), when there is low water availability, no fodder.
- Human health is also worse during the winter months (July-Sept). The issue of diseases (11th row), discussions focused on the most disease prone periods. For more details, during this exercise the communities indicated that from July to January, there is usually an outbreak of seasonal diseases like Malaria, during the rainy season (July-August-September), and; seasonal flu from October to January. Communities indicated that the fatigue accumulated during the harvesting season (3rd row) and water availability (4th row) are some of the aggravating factors.
- As far as expenses (9th row) are concerned, there are fewer expenses related to household care just after the harvests. In fact, during this period consumption is mainly derived from the harvest, and expenditure concerns other aspects such as education and health. Sometime afterwards, expenditure increases due to the reduction in food stocks and the need to prepare for the next season (seeds, inputs, etc.). Taking care of the animals during this period also requires expenditure due to the scarcity of grasses.
| Seasonal Calendar of the Lives of Animals and Communities | |
|---|---|
| Step 1 | a) Start a discussion by asking participants about the local calendar and seasonal landmarks, for example dry or rainy seasons, before or after festival periods or religious ceremonies. b) Ask the helper to draw a matrix on the ground or large piece of chart paper and list the identified seasons on the horizontal (top) axis including the months in which they fall. c) On the first line of the vertical axis, add the identified seasonal landmarks (1a). Instead of words, the group may identify unique characteristics of each season and depict these using a symbol or drawing. |
| Step 2 | a) Move on to a discussion about the present season and their main work during this season. Add the work to the vertical axis. Then ask about: b) Other work during the year c) Income generated from the main work d) Income generated from the other work e) general house expenditures throughout the year f) Big issues related to animals and humans, such as: • Animal illness/disease • Human illness/disease • Availability of water/feed/fodder, etc. |
| Step 3 | Decide with the group how they will display the situation. Encourage participants depict seasonal changes using locally available materials. You may also use symbols or simply write words on cards. For example: • Higher income levels can be shown by placing a lot of seeds/money on the month in which this occurs, while a decrease in income the next month is shown with just a few seeds. - Figure T6 used dots, or you can use dollar signs ($) for income, whereby five dots or $$$$$ = high income and a single dot or $ = low income (Rows 7, 8, 9) • On the same note, you can use the dots to represent abundance or scarcity. Abundance can be represented by 5 dots whereas a single 1 dot represents scarcity; and those in between can show relative references to abundance or scarcity. - Figure T6 used 5 dots for periods of high-water availability, 3 dots for average water availability and 1 dot for periods of water scarcity (Row 4). • You can also use by shading Dark colours to represent periods of abundance and light colours periods of scarcity. |
| Step 4 | Explore the relationships between different seasonal events, activities and problems for animals and humans, especially those that show changes at the same time. The availability of resources either in the form of fodder or water availability or income or spending shows you what kind of physical opportunities are available to create an enabling environment for people to change their behaviour towards their animal’s welfare. Also discuss any similarities between the well-being of animals and humans throughout the seasons. Once the calendar is complete, discuss the results of the activity with the group. |
| Step 5 | Record the community’s analysis and responses in your project action tracker. Leave the seasonal calendar with the community and take a copy/picture for your records. Follow up with the community later when you start action planning together. |
Facilitation Notes
- In exceptional cases, where there are more than 20 people in the group, consider dividing participants into smaller groups to compare the seasonal changes amongst different groups of people. Encourage people to arrange themselves into the smaller groups with those they feel share greatest similarities (e.g. men / women, owners / users).
- It may be helpful to have more than one facilitator to support/facilitate small group work and discussions, especially if there are many participants.
- Before starting this exercise, discuss the calendar focus areas (which specific aspects will be examined) and how it will be used to analyse how the welfare of working animals and their related livelihoods and well-being change in different seasons. Also, how certain changes may be linked or cause challenges in their capacity to care for their animals.
- Be clear that the aim of the activity is to discuss how seasonality affects animal welfare and people’s livelihoods and identify challenging seasons. In this way, participants’ expectations can best be managed, and potential frustrations or perceptions that facilitators are more interested in animals’ well-being than people, can be mitigated. This is particularly important given that some changes in livelihoods and well-being may be identified, but it may be beyond the capacity of the project to address them.
- New facilitators might look into historical weather and food security reports (FEWS NET) to gain an understanding of seasonal challenges that the community might be facing before meeting with the group, which will help with identifying dry/lean, rainy/fruitful seasons and historical water shortages.
Next Steps
Seasonal calendars during the rapport building stage might accompany or be created alongside one or more of the following tools:
- T3 Venn Diagram (T3a Resources and Services Venn Diagram) to understand identify animal-related resource and service providers animal-owning communities rely on most and their level of satisfaction with each one
- T4 Daily Activity Schedule to understand how people and animals in animal-owning communities spend their time
- T5 Gender Roles and Responsibilities to understand men’s and women’s roles in caregiving, and using and caring for animals
- T7 Historical Timeline to learn which major past events community members perceive to be significant to working animals and people.