QUICK LINKS
T3a: Local animal Service Provider venn diagram
t3B: Social networking venn diagram
T3a: Local Animal Service Provider Venn diagram
A Venn diagram seeks to represent relationships between individuals, groups and/or other key actors or resources by representing them as “components” or “nodes”, and the associations between them as links or lines. Various attributes such as colour, size, distance between and other properties may be used to characterize different kinds of relationships. For example, Venn diagrams have the potential to visually represent the relative importance of different relationships or resources, the frequency of interaction between actors, and/or access to different actors or resources. For the purpose of animal welfare, the tool has been adapted to analyse relationships between animal owners, users and/or caregivers and animal-related resource and service providers, as well as assess the relationships between individuals, groups, and actors important to the lives of animal-owning communities and their animals. The process of visually mapping relationships can inform planning by enabling targeted strengthening and/or development of new relationships, for both the community and the organization.
| Tool purpose: | Time needed: |
| • To identify animal-related resource and service providers animal-owning communities rely on most and their level of satisfaction with each one. • To identify the community’s preferred resource and service providers to build or strengthen their capacity, or improve relationships with those less preferred. • To identify gaps in service provision, which if addressed, could better meet the needs of animals and people. • The activity may be repeated to assess changes and improvements that have resulted from any activities implemented by communities and/or the facilitating organization. | 1.5 - 2 hours per diagram |
| Materials needed: | |
| Chart paper, coloured sticker dots and/or coloured markers, coloured index cards or sticky notes, large circular cut-out of different colours and sizes. |
Keyword Search Tags
Project Phase:
Initiation Phase, Planning Phase
Approaches for Working With Communities:
Community Development Approach, Community Engagement Approach
Behavioural Drivers (COM-B):
Behaviour Change Diagnosis and Planning
Project Support:
Participatory Learning and Action Tools, Needs Assessment
Specific Topics:
Animal Health and Services
Resource and service provider Venn diagram
This tool enables community members to identify all the animal-related resource and service providers on which they rely. Examples of resources include: water points, grazing land, fodder production or storage areas, grain grinders, animal shelters; while service providers may include: local animal health service providers, veterinarians, feed supply shops, working animals’ equipment shops and/or money lenders. This activity may build on information gathered in the T1 Mapping activity - related to the most important resources and services to the community - as it goes into more detail to understand usefulness, availability, frequency of use and satisfaction with each provider. Once identified, participants are able to analyze their relationships and usage of different resources and service providers, including their relative importance to the welfare of their working animals and people who depend on them.
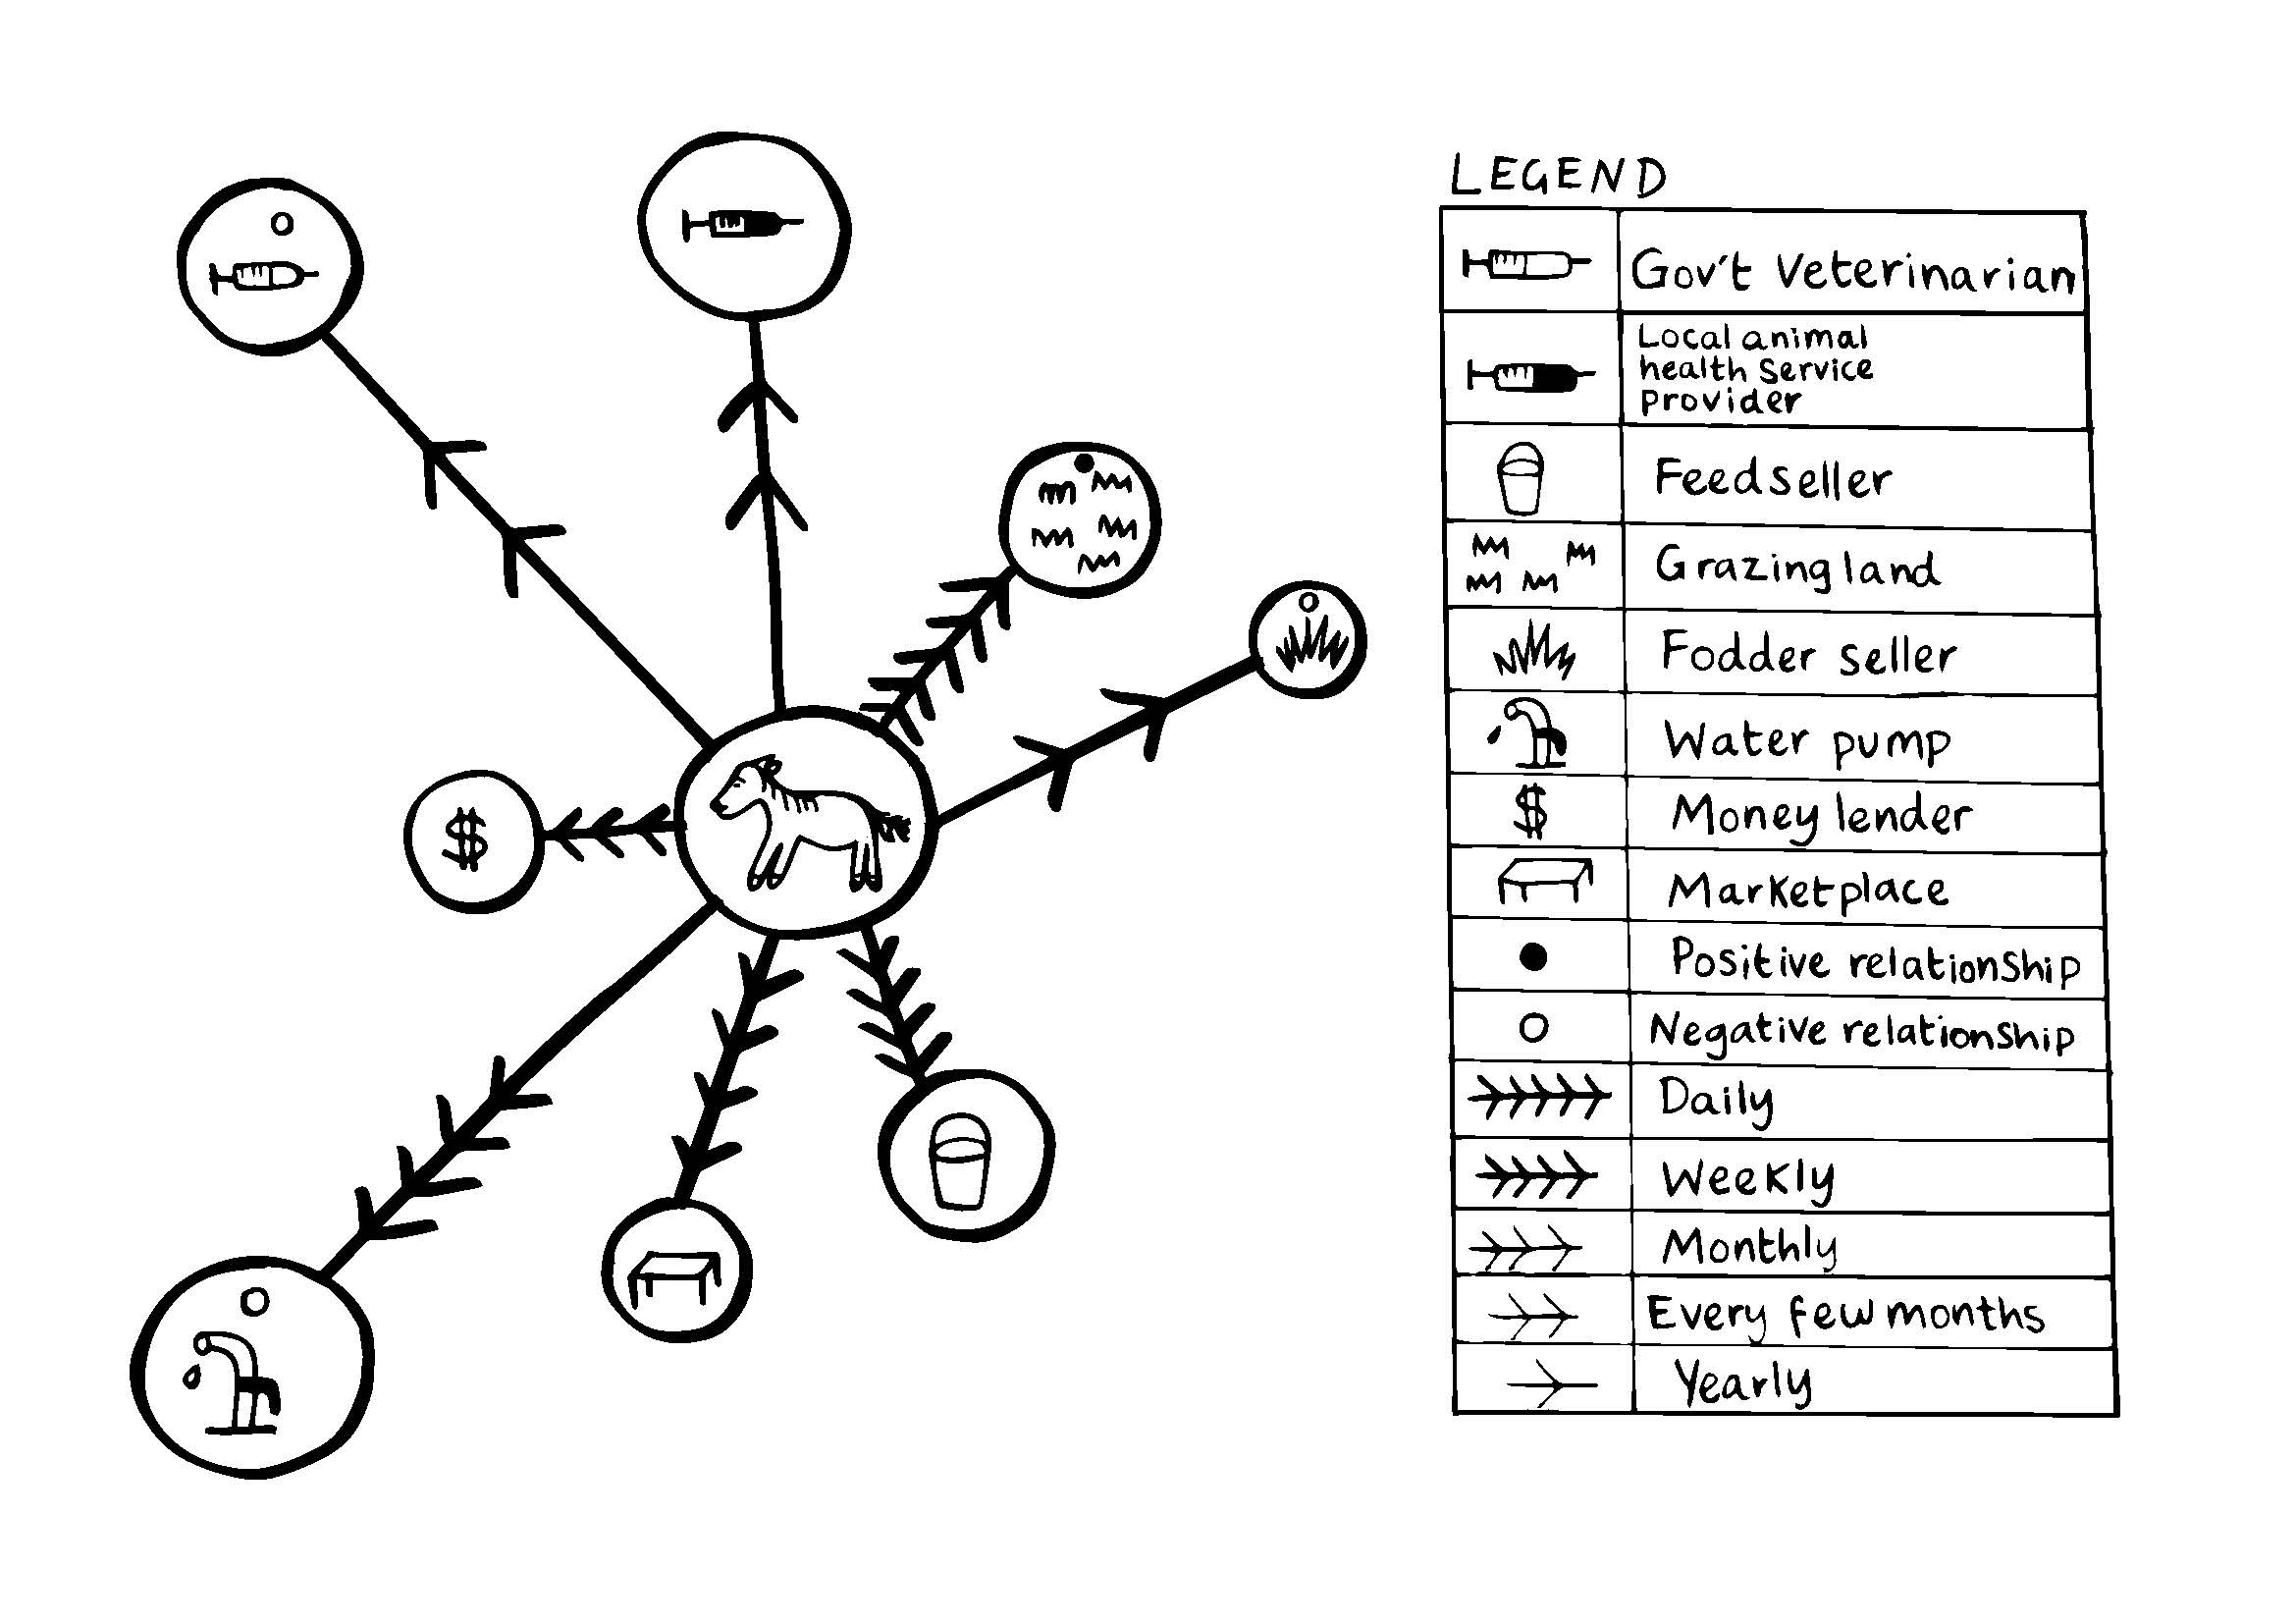
Figure T3A Venn diagram of a community’s animal-related resources and service providers
In the example above, members of an animal-owning community created Venn diagram to represent the animal-related resources and service providers they rely on. The size of the circles represent the perceived relative importance and usefulness. Distances from the centre represent availability and arrows represent frequency of use. Discussions highlighted the following important information:
- The government veterinarian is shown in a large circle because this service provider is perceived to be useful, and was placed far from centre circle due to their poor responsiveness/availability, with infrequent use indicated by two arrows.
- The local animal health service provider was felt to be more useful, represented by a slightly larger circle; however, their services are similarly used infrequently, despite their higher responsiveness/availability.
- Participants indicated satisfaction with the local animal health service provider due to their lower relative cost despite recognizing they provide lower quality care.
- They also indicated they were unsatisfied (red dot) with the government veterinarian due to their higher cost and low responsiveness, despite acknowledging that they provide higher quality service.
- Discussions also highlighted that participants only call the local animal health service provider if animals get very sick, identifying an absence of preventative animal health practices amongst animal-owning households.
| Resources and Service Provider Venn diagram | |
|---|---|
| Step 1 | Start by explaining the purpose of the exercise and then ask participants to identify the resource and service providers that are important to them in terms of usefulness to their animals. Ask them to start by first identify the MOST useful resources and service providers and represent them on the LARGEST size pre-cut circle of paper with words or symbols. Alternatively, they may use local materials and place them on top of the paper circles. Continue identifying the next most important/useful resources and service providers using the next smallest sized circle and so on, until all resources and service providers have been identified with the biggest circles representing the most useful resources and service providers, and the smallest circles representing the least useful. There is often a lot of debate and discussion while categorizing the usefulness of different resources and service providers. |
| Step 2 | Next ask participants to draw a picture representing their animals (or their community) in the centre and place the different sized circles representing resources and service providers around it. Then ask participants to move the resource/service provider circles closer or further away from the centre according to their availability e.g. enough resources or service provider responsiveness available when needed. Please note circle placement from the centre may be adapted to represent another variable. |
| Step 3 | Once all circles have been placed around the central circle, ask the ask the group to indicate which resources and service providers they use most frequently by drawing arrowheads on the lines between the centre circle and each resource or service provider. In the example above, a scale of 5 arrows was used to represent the following frequency parameters: • 4 arrows: weekly • 3 arrows: monthly • 2 arrows: every few months • 1 arrow: yearly Allow participants to define frequency parameters in a way that makes sense to them. |
| Step 4 | Next, ask participants to discuss their level of satisfaction with the resources or service providers. Symbols or objects may be placed on each circle representing the resource or service provider to indicate or score participants’ satisfaction (e.g. happy/sad face ☺/☹, or green/red dot 🟢/🔴, seeds or beans). There is often a lot of interesting discussion and insights generated while participants discuss resources and service providers they are satisfied or dissatisfied with. Additional dimensions may also be added to this Venn diagram exercise by asking participants to use beans, seeds, or stones to represent other variables. For example, participants can score the cost or quality of an animal-related resource or health service providers. |
| Step 5 | Once complete, encourage participants to discuss what the Venn diagram shows. Use the following questions to guide the discussion: • If not already discussed through during the creation of the diagram, it may be helpful to ask: Why some resources or service providers considered useful? Why are participants satisfied or unsatisfied with certain resources or service providers? Why are some resources or service providers relied on more frequently/infrequently? • Are there any resources or service providers missing from diagram which, if existed, could better help meet the needs of your animal? Why are they missing and why are they needed? • What changes in animal-related resources and service providers could better serve you and your animals? • What have you learned because of participating in this activity? |
| Step 6 | The diagram should be documented through photos or recreated on paper. Copies should be made and distributed to the group for their records, future reference and/or action planning. Add a copy to your project action tracker and note preferred resource and service providers. |
Facilitation Notes: Resource and service provider Venn diagram
- It is useful to examine perceptions of animal-related resources and service providers with different groups in a community as they may rely on or have different perceptions of resources and service providers. Consider asking both men and women from animal-owning households to participate in this activity; or if it is not feasible or appropriate to conduct this activity with both sexes together, consider conducting this activity separately.
- Facilitators should not control or insert their ideas into the diagram, but rather facilitate the process so that people design it themselves. Probing questions may be used to encourage people to think about the general categories of individuals, groups and actors to include.
- Facilitators are encouraged to adapt the parameters and symbols as needed to investigate topics of interest and/or simplify the activity.
- Try representing each resource and service provider on different pieces of paper, as it allows participants to move cards around throughout the discussion. However, the activity may also be drawn directly on the ground using chalk, sticks or stones as needed.
- If using paper circles, it is helpful to cut out a selection of different sizes ahead of time. Consider preparing at least 5 different sizes of circles to enable the relative importance of all identified resources and service providers to be effectively captured.
Next Steps
- Information on resource and service provider gaps identified in the initiation phase may be useful for informing discussions during the community action planning phase.
- Consider using T9 Matrix Ranking and Scoring to better understand the criteria informing animal-owning households’ preferences for different resources and/or service providers, explore their satisfaction/dissatisfaction in more detail and prioritize their preferences for community action planning.
- Use preferred resource and service providers, identified dissatisfaction and gaps in use or knowledge to inform project planning.
T3b: Social Networking Venn diagram
The social network Venn diagram illustrates relationships between individuals, groups and/or other key actors or resources by representing them as “components” or “nodes”, and the associations between them as links or lines. Various attributes such as colour, size and distance between each may be used to characterize different types of relationships. For example, Venn diagrams have the potential to visually represent the relative importance of different relationships or resources, the frequency of interaction between actors, and/or access to different actors or resources. For the purpose of animal welfare, the tool has been adapted to analyse relationships between animal owners, users and/or carers and animal-related resource and service providers, as well as assess the relationships between individuals, groups, and actors important to the lives of animal-owning communities and their animals. The process of visually mapping relationships can inform planning by enabling targeted strengthening and/or development of new relationships, for both the community and the organization.
| Tool purpose: | Time needed: |
| • To identify individuals, groups and key actors perceived to be important to households and their animals (positively or negatively). • To understand the relative importance of different actors. • To understand differences between men and women’s access to individuals, groups and key actors within their social network. • To inform planning by identifying social network gaps that, if addressed, could better meet the needs of animals and people. • This tool may be useful for identifying potential collaborators or partners already working in the community. | 2 hours |
| Materials needed: | |
| Chart paper or coloured dust, chalk, coloured sticker dots and/or coloured markers, coloured index cards or sticky notes, stones, sticks, seeds or beans. |
Keyword Search Tags
Project Phase:
Initiation Phase, Planning Phase
Approaches for Working With Communities:
Community Development Approach, Community Engagement Approach, Societal Outreach and Campaigns Approach
Behavioural Drivers (COM-B):
Behaviour Change Diagnosis and Planning, Opportunity
Project Support:
Participatory Learning and Action Tools, Needs Assessment, Gender Analysis
Social network Venn diagram
The social network Venn diagram can be used to analyse social networks within a community. The household or community could be the focal point for analysis.
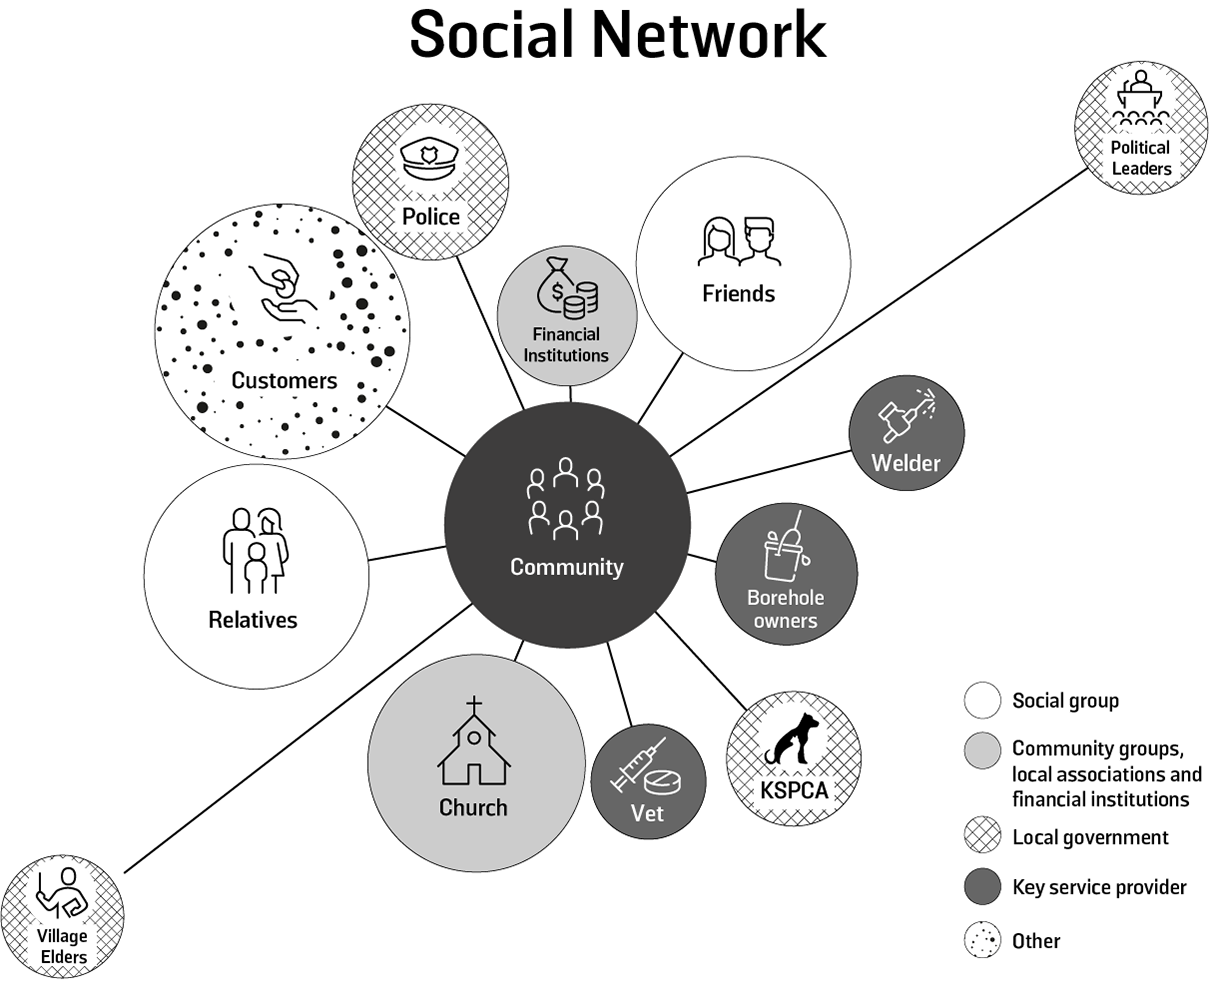
Figure T3B Venn diagram of a social network in Kenya
In the example above, a men’s equine welfare group in Kenya created a simple social network map. The central circle represented their community and different coloured circles were used to represent individuals, groups and other key actors with whom participants had relationships that were perceived to have an impact on their lives and the lives of their animals. Lines were drawn from each social connection to the centre, with the length of line representing the perceived strength of each relationship. The size of each circle represented the perceived importance of each relationship to their lives of the lives of their animals. In Kenya, as village elders have provincial administration capacity they are considered and categorized under local government. KSPCA (Kenyan Society for the Protection and Care of Animals) is also a non-governmental organization that has a mandated protection that is directly linked with the government.
| Social Network Venn Diagram | |
|---|---|
| Step 1 | Start by explaining the purpose of the exercise and ask participants to identify people, groups, and key actors that they perceive as significant to theirs and their animals’ lives. Use the following types of individuals, groups, and key actors (not resources) as a guide for probing the community, whilst keeping the conversation animal related. You can add more as contextually appropriate: • Social groups (e.g. close friends, relatives, neighbours) • Community groups, local associations and organizations, local financial institutions (e.g. self-help group) • Local government staff (e.g. social service officers) • Non-governmental organization (NGO) and/or agency staff • Key service providers • Others e.g. employers, market buyers/sellers, financial service providers Ask if there are any individuals, groups or organisations missing from the social network which, if existed, could better help meet household needs and/or the needs of your animal? Why are they missing and why are they needed? Ask the helper to write responses on different note cards or pieces of paper, asking the group which ones are most important (large circles), important (medium circles) and least important (small circles) ensuring they are colour categorised as above, using words or symbols and place them on the ground for all to see. |
| Step 2 | Ask the helper to draw a circle in the middle of the chart paper or on the ground and make a symbol representing their community in the centre. Organize all cards in large circle around the community circle. Next, ask participants to move the cards around the centre circle as per the relative strength of the relationship with those actors. Those closest to the centre represent the strongest relationships, while those farthest away the weakest. The facilitator should clarify the criteria that makes a weak versus a strong relationship, such as accessibility, availability, and level of satisfaction and whether they have a positive or negative impact on theirs and their animals’ lives. Place a symbol (e.g. +/- OR happy/sad face OR green/red dot) on each actor’s card to indicate the nature of the relationship, making sure it reflects the impact on both humans and animals. |
| Step 3 | Once all cards have been placed, ask participants which of the actors support their animals specifically. Mark the card with coloured dot or sticker representative of the animal. The more the dots or sticker representing the animal are placed on an actor, the more support the actor provides. |
| Step 4 | Ask participants to identify which relationships are accessible by men, women, or both, by placing a different indicative mark on the card (either using pens or stickers, or bean types). If the relationship is accessible to both men and women, ask whether accessibility is equal for both sexes. You may wish to place a > / = / < in between the representative marks or objects to indicate which sex has greater access. If it is just one group (e.g. only men) then this step is not necessary. |
| Step 5 | Once the social Venn diagram is complete, encourage participants to discuss what it shows (if not already identified through previous discussions). Consider using the following questions as a guide: • Why are some relationships perceived to be more or less important? • Why are certain actors more important for men or women? (If identified) • Are there differences between men, women and/or children within the household? • Why are some actors positively or negatively affecting people and their animals? • What changes in this network could improve yours and/or your animals’ lives? • What can you as an individual or group do to improve your relationships with these actors? • What have you learned because of participating in this activity? |
| Initiation Phase: | |
| Step 6 | The diagram should be documented through photos or recreated on paper. Copies should be made and distributed to the group for their records, future reference and/or action planning. Add a copy to your project action tracker. |
| Planning Phase: | |
| Step 7 | Have the community helper record any actions the group agrees to the community action plan. Record the community’s agreed actions and activities in your project action tracker and support the community by following up with any identified key stakeholders. |
Facilitation notes: Social Network Mapping
- Knowledgeable individuals can be consulted in advance to help identify key actors within the community, particularly governmental and NGO actors.
- Use different coloured note cards or marker colours to represent the different categories of relationships listed above to facilitate diagram analysis upon completion.
- Both men and women should be asked to participate, as they may have different relationships, value and access to/with actors. If it is not feasible or appropriate to conduct this activity with both men and women, conduct it separately.
- Consider having a co-facilitator/note-taker for this activity so that important insights from discussions can be effectively captured.
- The facilitator must focus the group on identifying primary types of individuals, groups, and key actors, rather than focus on actual names, as this will be different for every participant and will make it difficult for them to identify the relative importance or influence of these relationships in the next steps.
- Facilitators should not control or insert their ideas into the diagram, but rather facilitate the process so that people design it themselves. Probing questions may be used to encourage people to think about the general categories of individuals, groups and actors to include.
- Dominant personalities may take over during these discussions and the facilitator must make sure to involve people who are left out. Continue to seek out and encourage input from those who are not participating throughout the exercise. Ask if others agree with ideas of dominants, and consider assigning tasks to different persons throughout the exercise e.g. placement of cards, symbols etc.
- Often community members do not know the names of key government or NGO actors. In this case, encourage participants to simply explain the nature of the relationship or activities undertaken by these actors and investigate them later.
- Using paper cards or sticky notes is helpful as it allows participants to move cards around throughout the discussion. Consider using different colour papers or markers to represent different types of actors and create meaningful contrast and easier analysis upon completion of the activity.
- In the rapport building phase, the community leaders and chiefs will likely be in attendance and, therefore, a clear and accurate picture of the social system may not be possible, as participants may not feel possible speaking freely. Once trust is established and the group size is smaller, the facilitator will come to understand the true social dynamics.
Next Steps
- Plan to support the community to strengthen or develop relationships with key actors to support animal welfare improvements and address gaps in services.
- Keep a list of key stakeholders identified as important to the lives of the participants. Arrange meetings with them to discuss collaborations or future implementation activities (e.g. service providers, government officials, NGOs).
- Consider inviting identified relevant community leaders or active members of society to future meetings to help strengthen relationships and collaborations between the groups.