QUICK LINKS
T3a: Local animal Service Provider venn diagram
t3B: Social networking venn diagram
T3a: Local Animal Service Provider Venn diagram
A Venn diagram seeks to represent relationships between individuals, groups and/or other key actors or resources by representing them as “components” or “nodes”, and the associations between them as links or lines. Various attributes such as colour, size, distance between and other properties may be used to characterize different kinds of relationships. For example, Venn diagrams have the potential to visually represent the relative importance of different relationships or resources, the frequency of interaction between actors, and/or access to different actors or resources. For the purpose of animal welfare, the tool has been adapted to analyse relationships between animal owners, users and/or caregivers and animal-related resource and service providers, as well as assess the relationships between individuals, groups, and actors important to the lives of animal-owning communities and their animals. The process of visually mapping relationships can inform planning by enabling targeted strengthening and/or development of new relationships, for both the community and the organization.
| Tool purpose: | Time needed: |
• To identify animal-related resource and service providers animal-owning communities rely on most and their level of satisfaction with each one.
• To identify the community’s preferred resource and service providers to build or strengthen their capacity, or improve relationships with those less preferred.
• To identify gaps in service provision, which if addressed, could better meet the needs of animals and people.
• The activity may be repeated to assess changes and improvements that have resulted from any activities implemented by communities and/or the facilitating organization. | 1.5 - 2 hours per diagram |
| Materials needed: |
| Chart paper, coloured sticker dots and/or coloured markers, coloured index cards or sticky notes, large circular cut-out of different colours and sizes. |
Project Phase:
Initiation Phase, Planning Phase
Approaches for Working With Communities:
Community Development Approach, Community Engagement Approach
Behavioural Drivers (COM-B):
Behaviour Change Diagnosis and Planning
Project Support:
Participatory Learning and Action Tools, Needs Assessment
Specific Topics:
Animal Health and Services
Resource and service provider Venn diagram
This tool enables community members to identify all the animal-related resource and service providers on which they rely. Examples of resources include: water points, grazing land, fodder production or storage areas, grain grinders, animal shelters; while service providers may include: local animal health service providers, veterinarians, feed supply shops, working animals’ equipment shops and/or money lenders. This activity may build on information gathered in the T1 Mapping activity - related to the most important resources and services to the community - as it goes into more detail to understand usefulness, availability, frequency of use and satisfaction with each provider. Once identified, participants are able to analyze their relationships and usage of different resources and service providers, including their relative importance to the welfare of their working animals and people who depend on them.
Figure T3A Venn diagram of a community’s animal-related resources and service providers
In the example above, members of an animal-owning community created Venn diagram to represent the animal-related resources and service providers they rely on. The size of the circles represent the perceived relative importance and usefulness. Distances from the centre represent availability and arrows represent frequency of use. Discussions highlighted the following important information:
- The government veterinarian is shown in a large circle because this service provider is perceived to be useful, and was placed far from centre circle due to their poor responsiveness/availability, with infrequent use indicated by two arrows.
- The local animal health service provider was felt to be more useful, represented by a slightly larger circle; however, their services are similarly used infrequently, despite their higher responsiveness/availability.
- Participants indicated satisfaction with the local animal health service provider due to their lower relative cost despite recognizing they provide lower quality care.
- They also indicated they were unsatisfied (red dot) with the government veterinarian due to their higher cost and low responsiveness, despite acknowledging that they provide higher quality service.
- Discussions also highlighted that participants only call the local animal health service provider if animals get very sick, identifying an absence of preventative animal health practices amongst animal-owning households.
| Resources and Service Provider Venn diagram |
|---|
| Step 1 | Start by explaining the purpose of the exercise and then ask participants to identify the resource and service providers that are important to them in terms of usefulness to their animals. Ask them to start by first identify the MOST useful resources and service providers and represent them on the LARGEST size pre-cut circle of paper with words or symbols. Alternatively, they may use local materials and place them on top of the paper circles.
Continue identifying the next most important/useful resources and service providers using the next smallest sized circle and so on, until all resources and service providers have been identified with the biggest circles representing the most useful resources and service providers, and the smallest circles representing the least useful. There is often a lot of debate and discussion while categorizing the usefulness of different resources and service providers. |
| Step 2 | Next ask participants to draw a picture representing their animals (or their community) in the centre and place the different sized circles representing resources and service providers around it. Then ask participants to move the resource/service provider circles closer or further away from the centre according to their availability e.g. enough resources or service provider responsiveness available when needed.
Please note circle placement from the centre may be adapted to represent another variable. |
| Step 3 | Once all circles have been placed around the central circle, ask the ask the group to indicate which resources and service providers they use most frequently by drawing arrowheads on the lines between the centre circle and each resource or service provider.
In the example above, a scale of 5 arrows was used to represent the following frequency parameters:
• 4 arrows: weekly
• 3 arrows: monthly
• 2 arrows: every few months
• 1 arrow: yearly
Allow participants to define frequency parameters in a way that makes sense to them. |
| Step 4 | Next, ask participants to discuss their level of satisfaction with the resources or service providers. Symbols or objects may be placed on each circle representing the resource or service provider to indicate or score participants’ satisfaction (e.g. happy/sad face ☺/☹, or green/red dot 🟢/🔴, seeds or beans). There is often a lot of interesting discussion and insights generated while participants discuss resources and service providers they are satisfied or dissatisfied with.
Additional dimensions may also be added to this Venn diagram exercise by asking participants to use beans, seeds, or stones to represent other variables. For example, participants can score the cost or quality of an animal-related resource or health service providers. |
| Step 5 | Once complete, encourage participants to discuss what the Venn diagram shows. Use the following questions to guide the discussion:
• If not already discussed through during the creation of the diagram, it may be helpful to ask:
Why some resources or service providers considered useful?
Why are participants satisfied or unsatisfied with certain resources or service providers?
Why are some resources or service providers relied on more frequently/infrequently?
• Are there any resources or service providers missing from diagram which, if existed, could better help meet the needs of your animal? Why are they missing and why are they needed?
• What changes in animal-related resources and service providers could better serve you and your animals?
• What have you learned because of participating in this activity? |
| Step 6 | The diagram should be documented through photos or recreated on paper. Copies should be made and distributed to the group for their records, future reference and/or action planning. Add a copy to your project action tracker and note preferred resource and service providers. |
Facilitation Notes: Resource and service provider Venn diagram
- It is useful to examine perceptions of animal-related resources and service providers with different groups in a community as they may rely on or have different perceptions of resources and service providers. Consider asking both men and women from animal-owning households to participate in this activity; or if it is not feasible or appropriate to conduct this activity with both sexes together, consider conducting this activity separately.
- Facilitators should not control or insert their ideas into the diagram, but rather facilitate the process so that people design it themselves. Probing questions may be used to encourage people to think about the general categories of individuals, groups and actors to include.
- Facilitators are encouraged to adapt the parameters and symbols as needed to investigate topics of interest and/or simplify the activity.
- Try representing each resource and service provider on different pieces of paper, as it allows participants to move cards around throughout the discussion. However, the activity may also be drawn directly on the ground using chalk, sticks or stones as needed.
- If using paper circles, it is helpful to cut out a selection of different sizes ahead of time. Consider preparing at least 5 different sizes of circles to enable the relative importance of all identified resources and service providers to be effectively captured.
Next Steps
- Information on resource and service provider gaps identified in the initiation phase may be useful for informing discussions during the community action planning phase.
- Consider using T9 Matrix Ranking and Scoring to better understand the criteria informing animal-owning households’ preferences for different resources and/or service providers, explore their satisfaction/dissatisfaction in more detail and prioritize their preferences for community action planning.
- Use preferred resource and service providers, identified dissatisfaction and gaps in use or knowledge to inform project planning.
T3b: Social Networking Venn diagram
The social network Venn diagram illustrates relationships between individuals, groups and/or other key actors or resources by representing them as “components” or “nodes”, and the associations between them as links or lines. Various attributes such as colour, size and distance between each may be used to characterize different types of relationships. For example, Venn diagrams have the potential to visually represent the relative importance of different relationships or resources, the frequency of interaction between actors, and/or access to different actors or resources. For the purpose of animal welfare, the tool has been adapted to analyse relationships between animal owners, users and/or carers and animal-related resource and service providers, as well as assess the relationships between individuals, groups, and actors important to the lives of animal-owning communities and their animals. The process of visually mapping relationships can inform planning by enabling targeted strengthening and/or development of new relationships, for both the community and the organization.
| Tool purpose: | Time needed: |
• To identify individuals, groups and key actors perceived to be important to households and their animals (positively or negatively).
• To understand the relative importance of different actors.
• To understand differences between men and women’s access to individuals, groups and key actors within their social network.
• To inform planning by identifying social network gaps that, if addressed, could better meet the needs of animals and people.
• This tool may be useful for identifying potential collaborators or partners already working in the community. | 2 hours |
| Materials needed: |
| Chart paper or coloured dust, chalk, coloured sticker dots and/or coloured markers, coloured index cards or sticky notes, stones, sticks, seeds or beans. |
Project Phase:
Initiation Phase, Planning Phase
Approaches for Working With Communities:
Community Development Approach, Community Engagement Approach, Societal Outreach and Campaigns Approach
Behavioural Drivers (COM-B):
Behaviour Change Diagnosis and Planning, Opportunity
Project Support:
Participatory Learning and Action Tools, Needs Assessment, Gender Analysis
Social network Venn diagram
The social network Venn diagram can be used to analyse social networks within a community. The household or community could be the focal point for analysis.
Figure T3B Venn diagram of a social network in Kenya
In the example above, a men’s equine welfare group in Kenya created a simple social network map. The central circle represented their community and different coloured circles were used to represent individuals, groups and other key actors with whom participants had relationships that were perceived to have an impact on their lives and the lives of their animals. Lines were drawn from each social connection to the centre, with the length of line representing the perceived strength of each relationship. The size of each circle represented the perceived importance of each relationship to their lives of the lives of their animals. In Kenya, as village elders have provincial administration capacity they are considered and categorized under local government. KSPCA (Kenyan Society for the Protection and Care of Animals) is also a non-governmental organization that has a mandated protection that is directly linked with the government.
| Social Network Venn Diagram |
|---|
| Step 1 | Start by explaining the purpose of the exercise and ask participants to identify people, groups, and key actors that they perceive as significant to theirs and their animals’ lives. Use the following types of individuals, groups, and key actors (not resources) as a guide for probing the community, whilst keeping the conversation animal related.
You can add more as contextually appropriate:
• Social groups (e.g. close friends, relatives, neighbours)
• Community groups, local associations and organizations, local financial institutions (e.g. self-help group)
• Local government staff (e.g. social service officers)
• Non-governmental organization (NGO) and/or agency staff
• Key service providers
• Others e.g. employers, market buyers/sellers, financial service providers
Ask if there are any individuals, groups or organisations missing from the social network which, if existed, could better help meet household needs and/or the needs of your animal? Why are they missing and why are they needed?
Ask the helper to write responses on different note cards or pieces of paper, asking the group which ones are most important (large circles), important (medium circles) and least important (small circles) ensuring they are colour categorised as above, using words or symbols and place them on the ground for all to see. |
| Step 2 | Ask the helper to draw a circle in the middle of the chart paper or on the ground and make a symbol representing their community in the centre. Organize all cards in large circle around the community circle.
Next, ask participants to move the cards around the centre circle as per the relative strength of the relationship with those actors. Those closest to the centre represent the strongest relationships, while those farthest away the weakest. The facilitator should clarify the criteria that makes a weak versus a strong relationship, such as accessibility, availability, and level of satisfaction and whether they have a positive or negative impact on theirs and their animals’ lives. Place a symbol (e.g. +/- OR happy/sad face OR green/red dot) on each actor’s card to indicate the nature of the relationship, making sure it reflects the impact on both humans and animals. |
| Step 3 | Once all cards have been placed, ask participants which of the actors support their animals specifically. Mark the card with coloured dot or sticker representative of the animal. The more the dots or sticker representing the animal are placed on an actor, the more support the actor provides. |
| Step 4 | Ask participants to identify which relationships are accessible by men, women, or both, by placing a different indicative mark on the card (either using pens or stickers, or bean types). If the relationship is accessible to both men and women, ask whether accessibility is equal for both sexes. You may wish to place a > / = / < in between the representative marks or objects to indicate which sex has greater access. If it is just one group (e.g. only men) then this step is not necessary. |
| Step 5 | Once the social Venn diagram is complete, encourage participants to discuss what it shows (if not already identified through previous discussions).
Consider using the following questions as a guide:
• Why are some relationships perceived to be more or less important?
• Why are certain actors more important for men or women? (If identified)
• Are there differences between men, women and/or children within the household?
• Why are some actors positively or negatively affecting people and their animals?
• What changes in this network could improve yours and/or your animals’ lives?
• What can you as an individual or group do to improve your relationships with these actors?
• What have you learned because of participating in this activity? |
| Initiation Phase: |
| Step 6 | The diagram should be documented through photos or recreated on paper. Copies should be made and distributed to the group for their records, future reference and/or action planning. Add a copy to your project action tracker. |
| Planning Phase: |
| Step 7 | Have the community helper record any actions the group agrees to the community action plan.
Record the community’s agreed actions and activities in your project action tracker and support the community by following up with any identified key stakeholders. |
Facilitation notes: Social Network Mapping
- Knowledgeable individuals can be consulted in advance to help identify key actors within the community, particularly governmental and NGO actors.
- Use different coloured note cards or marker colours to represent the different categories of relationships listed above to facilitate diagram analysis upon completion.
- Both men and women should be asked to participate, as they may have different relationships, value and access to/with actors. If it is not feasible or appropriate to conduct this activity with both men and women, conduct it separately.
- Consider having a co-facilitator/note-taker for this activity so that important insights from discussions can be effectively captured.
- The facilitator must focus the group on identifying primary types of individuals, groups, and key actors, rather than focus on actual names, as this will be different for every participant and will make it difficult for them to identify the relative importance or influence of these relationships in the next steps.
- Facilitators should not control or insert their ideas into the diagram, but rather facilitate the process so that people design it themselves. Probing questions may be used to encourage people to think about the general categories of individuals, groups and actors to include.
- Dominant personalities may take over during these discussions and the facilitator must make sure to involve people who are left out. Continue to seek out and encourage input from those who are not participating throughout the exercise. Ask if others agree with ideas of dominants, and consider assigning tasks to different persons throughout the exercise e.g. placement of cards, symbols etc.
- Often community members do not know the names of key government or NGO actors. In this case, encourage participants to simply explain the nature of the relationship or activities undertaken by these actors and investigate them later.
- Using paper cards or sticky notes is helpful as it allows participants to move cards around throughout the discussion. Consider using different colour papers or markers to represent different types of actors and create meaningful contrast and easier analysis upon completion of the activity.
- In the rapport building phase, the community leaders and chiefs will likely be in attendance and, therefore, a clear and accurate picture of the social system may not be possible, as participants may not feel possible speaking freely. Once trust is established and the group size is smaller, the facilitator will come to understand the true social dynamics.
Next Steps
- Plan to support the community to strengthen or develop relationships with key actors to support animal welfare improvements and address gaps in services.
- Keep a list of key stakeholders identified as important to the lives of the participants. Arrange meetings with them to discuss collaborations or future implementation activities (e.g. service providers, government officials, NGOs).
- Consider inviting identified relevant community leaders or active members of society to future meetings to help strengthen relationships and collaborations between the groups.
Link to References Cited
QUICK LINKS
T4a: Daily Activity schedule - community
t4b: Animal Daily Activity Schedule
T4a: Daily Activity Schedule - Community
A daily activity schedule is a chart showing how animal-owning families spend their time, including the time of day that each activity takes place and the time it takes to complete each one. This exercise identifies important times of the day, for example times when people are busy working, when they spend time with their working animals, or when they are free to discuss their common problems. This activity can be used to initiate a discussion about the best times to plan animal welfare activities, to hold a community meeting or for you (the facilitator) to visit the community. Step-by-step guidance for conducting this activity is provided in relation to daily activity schedules for both people and animals.
| Tool purpose: | Time needed: |
• To understand which activities, take up the most and least time
• To identify the best time to meet with individuals and community members and times when they are not available.
• To identify who cares for the animals in each household and in what capacity.
• To identify times when individuals are overburdened and why.
• To identify potential opportunities for sharing or shifting workloads of men, women, and other family members to improve the well-being of people and animals. | 1.5-2 hours |
| Materials needed: |
| Chart paper and markers or using sticks, stones, straw, local resources |
Project Phase:
Initiation Phase, Implementation Phase
Approaches for Working With Communities:
Community Development Approach, Community Engagement Approach, Societal Outreach and Campaigns Approach
Behavioural Drivers (COM-B):
Behaviour Change Diagnosis and Planning
Project Support:
Participatory Learning and Action Tools, Needs Assessment, Gender Analysis
Daily activity schedule of the animal-owning community
This chart (Figure T4A) explores and compares how animal owners, users and carers spend their work and leisure time. This exercise is a useful, non-threatening exercise that looks at real life experiences and helps people to understand the roles and responsibilities of different family members towards their animals. It can be used to analyse the factors that influence different people’s roles and activities, and to understand the problems and obstacles faced when dealing with animals.
Figure T4 Daily Activity Schedule of an animal-owning community
In this exercise (Figure T4a above), men, women and children listed all their activities between getting up at 5am and going to bed at 9pm.
- Women start cleaning the animals’ shelter, preparing the morning meal and fetching water with the children between 5 and 7am.
- Men and children pray between 5 and 7am.
- Men take the animal out to work at 9am.
- Women are involved in feeding, watering and cleaning up after animals several times a day, while men are involved with their animal only between 9am and 2pm and at 8pm for a final feed.
- Children clean the animals’ shelter between 3 and 6pm.
- Men are the main income generators and users of the animals, whilst women participate in alternative income generating activities at the market.
This initiated a discussion about the roles and responsibilities of family members in caring for the animals and how some responsibility might be shifted to men.
| Daily Activity Schedule of the Animal-Owning Community |
|---|
| Step 1 | Start by explaining the purpose of exercise to the participants and agree whose daily activities to chart first. This can be the animal owner/carer or members of the owner’s family. Agree whether to make a circular clock or a line chart to represent time. Decide whether to show time in hours or as parts of the day, such as morning, afternoon, and evening. The example above provides a numeric representation of time.
Show daily activities using symbols placed at the appropriate time of day. |
| Step 2 | Start a discussion about the activities that a person or a group of people normally do, from when they get up in the morning until they go to sleep. Ask participants to list the activities in ascending order from morning to night.
Key points might include:
• Free time and work time
• Times when animals are fed, or the animal shelter is cleaned
• When animals are taken for grazing
• When animals are offered feed and water
• When people groom or clean animals |
| Step 3 | Ask when people have free time to take part in other activities, either individually or as a group.
• How is other/spare time spent? Do they have spare time?
• What are other income generating activities and how much time is spent on those?
• What social activities should be included in the list? |
| Step 4 | Once daily schedules are complete, discuss results with participants.
Consider these questions:
• How do participants feel about the way they use their time throughout the day?
• Why are some people responsible for some tasks while others are responsible for others?
• Which periods are busiest or most stressful? Why?
• Which activities are most important for meeting the needs of the household? The animal? Why?
• Are any activities felt to be very burdensome? Why?
• Are there any ways in which some activities could be made easier?
If feasible, bring the two groups back together to discuss any differences in perceived division of daily activities of different people in the two charts.
Summarize the results of the activity and discussion and ask participants to reflect on what they learned through this activity. |
| Step 5 | Once the activity is complete, take a photo or record of the chart on a piece of paper, ensuring the community has a copy for their records. A copy is retained by the facilitator for future reference or planning. Add any notes regarding when people are available (men, women, children, all) in your project action tracker. |
Facilitator’s notes: Daily activity schedule – animal-owning community
- Daily activity charts are best made by individuals and small groups, so divide up larger groups to make charts for different people, such as men, women and children.
- Encourage men and women to create separate charts to enable comparison of perceptions of each other’s daily activities. This will help with identifying the best time to plan community visits with men, women and/or both.
- Remember that you are not controlling the exercise. Give confidence to people so that they gradually take over the entire process themselves.
- You might want to discuss how daily routines change depending on the time of the week or the season.
Next Steps
- As part of rapport building stage in the initiation phase, the daily activity schedule might follow on with one of the following activities:
- T1 Mapping to understand which resources and services are important to the community.
- T5 Gender Roles and Responsibilities to understand men’s and women’s animal care-giving and use roles and responsibilities, and identify whether they desire changes in the division of labour.
- T6 Seasonal Calendar to identify periods of scarcity and risk for the community.
- T7 Historical Timeline to learn which major past events community members perceive to be significant to working animals and people
- As part of a community needs assessment and shared vision, the daily activity schedule for the animal-owning community might accompany one or more of the following tools to get a full picture of community dynamics and needs for project planning:
- T1 Mapping to understand which resources and services are important to the community.
- T2 Mobility Map to understand where people spend most of their time and how long it takes to get places
- T3 Venn Diagram (T3b Social Networking Venn Diagram) to identify key individuals, groups and actors perceived to be most important to people and their animals.
- T5 Gender Roles and Responsibilities to understand men’s and women’s animal care-giving and use roles and responsibilities, and identify whether they desire changes in the division of labour.
- T6 Seasonal Calendar to identify periods of scarcity and risk for the community.
T4b: Animal Daily Activity Schedule
The chart produced in this version of the daily activity schedule illustrates how working animals spend their time, during both work periods and rest periods. It looks at a daily routine from the animal’s point of view and identifies where improvements to welfare could be made, such as increasing the time available to animals for rest, play or grazing. The animal’s daily activity schedule differs from the community’s schedule as it looks in-depth at how only the animals’ time is spent during the day, rather than humans.
| Tool purpose: | Time needed: |
• To understand animals’ daily activities and promote understanding of ways it supports meeting their needs in terms of the five domains of welfare
• To identify opportunities for improving animal welfare through husbandry and management practices | 1.5-2 hours |
| Materials needed: |
| Chart paper and markers or using sticks, stones, straw, local resources |
Project Phase:
Initiation Phase, Planning, Implementation
Approaches for Working With Communities:
Community Development Approach, Community Engagement Approach
Behavioural Drivers (COM-B):
Behaviour Change Diagnosis and Planning, Capability
Project Support:
Participatory Learning and Action Tools, Needs Assessment
Specific Topics:
Animal Husbandry and Management; Animal Welfare, Feelings and Needs
Daily activity schedule of the animal
Figure T4B Daily activity schedule of the working animal
This daily activity schedule for animals (Figure T4B, above) was used to initiate a discussion on animal welfare issues amongst rural workers, who use their equine animals to generate income by transporting goods and people to markets and tourist places. The animals’ day starts with their feeding trough being cleaned at 6am, followed by being fed at 6am. The animals are harnessed to carts at 8am and start their work at the market at 8:30am. Water is offered between 11:30am and midday, and again at 5pm when the animals return home. A second feeding is offered after finishing work 6pm From 7 to 8pm animals are provided free time to graze and roll. They are groomed between 8 and 9pm and the last feed is given between 9 and 10pm.
| Daily Activity Schedule of the Animal |
|---|
| Step 1 | Start by explaining the purpose of exercise and agree whether to make a circular clock or a line chart to represent time. Decide whether to show time in hours or as parts of the day, such as morning, afternoon, and evening. |
| Step 2 | Start a discussion about the activities that animals are involved in from morning to night. Ask them to list all the activities in order, both with them and other users. Show daily activities using symbols placed at the appropriate time of day. |
| Step 3 | Encourage participants to include some of the following activities in the animals’ daily activity schedule:
• Resting and working time
• When animals are taken for grazing
• When animals are offered feed and water
• When animals are groomed or cleaned
• When animals can socialise with other animals
• When animals can perform instinctive behaviours (e.g. rolling around) |
| Step 4 | Once the animals’ activity schedule is complete, discuss results with participants.
Consider the following guiding questions:
• What do participants think their animals feel about the activities they do throughout the day?
• When do you think animals feel most hungry/thirsty?
• Do animals have time to satisfy and engage in natural behaviours?
(In natural environment or with other animals e.g. rolling, grazing/roaming, socializing)
• Which activities are most important for meeting the animals’ needs? Why?
• Which periods are considered as heavy workload or strenuous?
• Are there some activities that could be made easier/less strenuous for the animal?
Summarize the results of the activity and discussion and ask participants to reflect on what they learned through this activity. |
| Step 5 | Once the activity is complete, take a photo or record of the chart on a piece of paper, ensuring the community has a copy for their records. A copy is retained by the facilitator for future reference or planning. Add any important notes to your project action tracker. |
Facilitator’s notes: Daily activity schedule – animal-owning community
- Animals at one place of work may have different work types, so divide groups by animals’ work type to produce the daily activity schedules.
- Encourage men and women to create separate charts to enable comparison of perceptions of each other’s daily activities. This will help with identifying the best time to plan community visits with men, women and/or both.
- Remember that you are not controlling the exercise. Give confidence to people so that they gradually take over the entire process themselves.
- You might want to discuss how daily routines change depending on the time of the week or the season.
Next Steps
- As part of rapport building stage in the initiation phase, the daily activity schedule might follow on with one of the following activities:
- T1 Mapping to understand which resources and services are important to the community.
- T5 Gender Roles and Responsibilities to understand men’s and women’s animal care-giving and use roles and responsibilities, and identify whether they desire changes in the division of labour.
- T6 Seasonal Calendar to identify periods of scarcity and risk for the community.
- T7 Historical Timeline to learn which major past events community members perceive to be significant to working animals and people
- As part of a community needs assessment and shared vision, the daily activity schedule for the animal-owning community might accompany one or more of the following tools to get a full picture of community dynamics and needs for project planning:
- T1 Mapping to understand which resources and services are important to the community.
- T2 Mobility Map to understand where people spend most of their time and how long it takes to get places
- T3 Venn Diagram (T3b Social Networking Venn Diagram) to identify key individuals, groups and actors perceived to be most important to people and their animals.
- T5 Gender Roles and Responsibilities to understand men’s and women’s animal care-giving and use roles and responsibilities, and identify whether they desire changes in the division of labour.
- T6 Seasonal Calendar to identify periods of scarcity and risk for the community.
Link to References Cited
QUICK LINKS
T5 Gender Roles and Responsibilities Resources and Services
T5 community activity
T5 Facilitator's NOTES
T2 NEXT STEPS
T5 Gender Roles and Responsibilities Resources and Services
This adapted gender roles and responsibilities activity explores the division of labour and workload between men, women, boys and girls related to animal care and use [49]. All family members are usually responsible for looking after the animals in the household, although different people are responsible for different tasks and use animals for different purposes. Sometimes animal welfare interventions unintentionally target only men or only women. However, to improve all aspects of animal welfare and promote gender equality, both men, women and children who play a role in the lives of animals should be invited to participate in this activity. It can be helpful to conduct T4 Daily Activity Schedule prior to undertaking this activity so you can contextualize gender roles and responsibilities related to animal care and use understand within men’s and women’s broader daily activities and associated time and labour commitments.
| Tool purpose: | Time needed: |
• To understand men’s and women’s animal care-giving and use roles and responsibilities, and identify whether they desire changes in the division of labour.
• To inform appropriate targeting of animal welfare extension messages, capacity building and training to relevant household members
• As a useful entry point activity for involving men and women in an animal welfare improvement project and beginning to understand different opportunities and constraints men and women face in promoting animal welfare. | 2 hours |
| Materials needed: |
| Markers, chart paper, post-it notes, cards or coloured powder/chalk, sticks, stones, beans or other locally available activities. |
Project Phase:
Initiation, Planning, Evaluation and Exit
Approaches for Working With Communities:
Community Development Approach; Community Engagement; Social Outreach and Campaigns
Behavioural Drivers (COM-B):
Behaviour Change Diagnosis and Planning, Opportunity
Project Support:
Participatory Learning and Action (PLA) Tools, Needs Assessment, Gender Analysis
Specific Topics:
Animal Husbandry and Management
Gender roles & responsibilities
An animal-owning community in Halaba, Ethiopia, used this activity to explore differences in roles and responsibilities between men and women. The group of men and women started by identifying animal use and care activities together. The mixed group then divided into two smaller groups - one group of men and one group of women - to examine the distribution separately. The group used 10 pebbles to score the division of labour for each identified activity.
Figure T5A Animal-related men’s and women’s roles and responsibilities
Men and women viewed the differences in division of roles and responsibilities differently, as reflected in figure T5A. In many cases, men considered themselves to have more responsibility for caring for animals than women. For example, men claimed that they are the main seekers of service provision and health treatment (vaccinations) for animals. The main differences between men and women were:
- Women have more responsibility for providing water and cleaning the animal’s shelter
- Men have more responsibility for grooming, cleaning equipment, allowing the animals the play and roam freely
- Men use animal’s more for incoming generating activities
- Women came up with more animal use activities following the division of women’s and women’s groups
Once the mixed group of men and women were divided, women identified three more categories of animal usage (highlighted in red), which men were mostly responsible for, including transporting agriculture for household consumption (urban to rural), transporting agricultural inputs for household use and free transport of people around the community or to local events.
Participants discussed why some of the activities were only carried out by men or women and what effect this had on their animals. Men commented that women do more for the animals than they would have acknowledged before undertaking the activity and that there might be an opportunity for women to take on more responsibility. Women also expressed an interest in taking on more responsibility and suggested an opportunity for:
- Men to share more of the water provision and shelter cleaning activities
- Women to share more of the equipment cleaning and hoof care activities
- Women to use the animals more for income-generating activities
Following the community activity, the facilitators examined the two charts side-by-side and identified an opportunity for training women on humane handling, which they had already provided to men and witnessed significant improvements. They noted this opportunity in the team action tracker and made a point of discussing interest with the group in the next community session.
| Gender Roles and Responsibilities |
|---|
| Step 1 | Ask the community helper to draw a large table, either on the ground or on chart paper. There should be three main columns: ‘activities’, ‘men’ and ‘women’.
Please note: Additional columns can be added to include boys and girls (children) if desired. |
| Step 2 | Ask participants about the activities and decisions men and women are responsible for related to the care and use of their animals. Have the community helper write them down on cards using words or drawings or use locally available materials representative of the activities identified. If this activity is being conducted about working animals, once all activities related to care have been identified, ask participants to identify any ways they use their animal, and have the community helper list these within the first column.
Include activities carried out on a daily, weekly, or monthly basis (e.g. seasonal, or periodic work such as festivals or special events), as well as key decisions important to the care and use of the animal |
| Step 3 | Ask the group to indicate how the workload for each identified activity is divided or shared between men and women (and boys and girls if included), using up to ten seeds, stones, or marks/dots to score their relative contributions. You might start the conversation by asking the question: ‘Who is responsible for each activity?’
For example: A score of 10 = full responsibility; 0 = no responsibility. If men and women are both responsible for carrying out the activity, the pebbles would be divided equally (see figure T5A, in ‘care’ + ‘feeding’, men and women scored evenly).
Once the chart is complete, ask the community helper to circle the scores with large discrepancies between men’s and women’s responsibilities. |
| Step 4 | Ask the community to discuss the results of the activity. The facilitator or supporting note taker should take notes on key insights that emerge from the discussion.
Consider using the following guiding questions to facilitate the discussion:
• Who is predominantly responsible for care? For use? How were these roles and responsibilities determined?
• Referring to identified discrepancies circled in the chart, why are these activities predominantly done by men or women?
• How would animal welfare improve if roles and responsibilities in animal care and usage were shared more between men and women within the household?
• What would need to change to give them greater opportunities to share their roles and responsibilities in animal care and usage between men and women within the household?
If feasible, bring the two groups back together to discuss any differences in scoring of perceived roles and responsibilities of men and women in the two charts, along with any desired changes to roles and responsibilities identified by each group.
Summarize the results of the activity and discussion and ask participants to reflect on what they learned through this activity. |
| Step 5 | Once the activity is complete, take a photo or record of the outputs on a piece of paper, ensuring the community has a copy for their records. A copy is retained by the facilitator for future reference or planning.
Take note of any of following identified during this activity within your project action tracker:
• Roles and responsibilities of men and women related to animal care and use – for tailoring communications and trainings as needed
• Changes in gender roles and responsibilities identified by participants as having potential to improve animal welfare
• Changes recommended by participants as necessary to creating greater opportunities for sharing roles in animal care and use to improve animal welfare.
• Social and physical opportunities, capability, and/or motivational/self-belief drivers related to men’s and women’s animal care and use roles and responsibilities which you as a facilitator identified through discussions.
• Key influencers/gatekeepers of gender roles and responsibilities mentioned by participants during discussions |
Facilitator’s notes: Gender roles & responsibilities
- As topics related to gender may be sensitive, facilitators are encouraged to gauge participant’s level of comfort to effectively facilitate group discussion.
- The gender roles and responsibilities activity works best when carried out in small groups of men and women separately, with each group analysing the gendered division of labour/work for both male and female members of the household. Depending on what is culturally appropriate in the local context, the two groups may be brought back together at the end of the activity to review the results of each chart and discuss any differences if feasible.
- This activity can highlight societal wide patriarchal assumptions and related social opportunities (e.g. social norms, peer support), physical opportunities (e.g. time, access to resources and services), as well as capability and motivational elements related to self-beliefs and societal values, which may either hamper or hinder certain animal care and use practices as a result of people’s gender. Listen for these within discussions and note them in the team action tracker if they emerge.
- It is important to recognize that the interplay between social, economic, and/or other vulnerable statuses may result in members of the same gender group having different roles and responsibilities and levels of paid and unpaid, labour burdens (e.g. women of higher socioeconomic status may transfer their roles and responsibilities to women of lower socioeconomic status). It is important to enable these different experiences to be acknowledged and understood.
- Discussions may identify potential (positive or negative) influencers or gate keepers that affect men and women’s roles and responsibilities related to animal care and use. Observe and listen to understand who influences gender roles and responsibilities (e.g. household member, social norms) and whether any changes in roles and responsibilities to improve animal welfare are desired. Take note of any identified key influencers for consideration in future involvement in the project as appropriate to supporting the desired changes in animal care and use roles and responsibilities. Key influencers may need to be engaged at the household level to influence household decisions, or to engaged to influence norms at the broader societal level.
Next Steps
As part of a community needs assessment and shared vision, the gender roles and responsibilities activity is useful to conduct when accompanied by one or more of the following tools to get a full picture of community dynamics for informing project planning:
- T1 Mapping to understand which resources and services are important to the community.
- T2 Mobility Map to understand where people spend most of their time and how long it takes to get places.
- T3 Venn Diagram (T3b Social Networking Venn Diagram) to identify key individuals, groups and actors perceived to be most important to people and their animals.
- T4 Daily Activity Schedule (if not yet carried out) to understand broader labour burdens and the activities which are most time consuming.
- T6 Seasonal Calendar to identify seasonal trends in resources, activities, and potential risks to animal owning communities.
Link to References Cited
QUICK LINKS
T8a: Pairwise Ranking and Scoring of Animal Welfare Issues
T8b: Pairwise Ranking and Scoring of Animal Health Service Providers
T8c: Pairwise Ranking and Scoring of Animal Diseases
This PLA tool can support identification of community priorities related to a variety of topics, and you are encouraged to adapt the tool as needed to address topics relevant to your project.
Step-by-step guidance for conducting this activity is provided related to the following three topics:
- T8a: Pairwise Ranking and Scoring of Animal Welfare Issues
- T8b: Pairwise Ranking and Scoring of Animal Health Service Providers
- T8c: Pairwise Ranking and Scoring of Animal Diseases
T8a: Pairwise Ranking and Scoring of Animal Welfare Issues
This tool uses a matrix to make direct comparisons between issues, such as beating, over-loading, poor feeding practices, etc. It is used to prioritize welfare issues for taking action, which can be a useful next step after participatory welfare needs assessment (See T22 Animal Welfare Transect Walk) has been carried out. This tool is similar to T9 Matrix Ranking and Scoring in that it prioritizes issues important to communities, however does so in a quicker and simpler way, without explicitly including criteria participants use when prioritizing issues. However, reasons for particular preferences can still emerge during discussions as participants decide on their priorities. As such, this tool may be used instead of, or before a more in-depth matrix ranking and scoring activity.
| Tool purpose: | Time needed: |
| • To support animal owning communities in identifying the animal welfare issues they feel are the biggest priorities to address | 1.5-2 hours |
| Materials needed: |
| Coloured powder, chalk, stick, tree leaves, coloured cards; chart paper and markets, or other locally available materials to represent identified criteria. |
Project Phase:
Planning Phase
Approaches for Working With Communities:
Community Development Approach, Community Engagement Approach
Project Support:
Participatory Learning and Action Tools, Needs Assessment, Gender Analysis
Specific Topics:
Animal Welfare, Feelings, and Needs
Pair-wise ranking and scoring of animal welfare issues
T8A Pairwise ranking and scoring of animal welfare issues in Faisalabad, Pakistan
A group of animal owners in a Brick kiln community in Faisalabad, Pakistan, ranked animal welfare issues identified in their locality according to the level of prioritization. The identified lack of available shade/shelter, inadequate provision of water, inadequate provision of mixed feed, overloading, beating and lack of timely treatment. Inadequate provision of water (score 5) and inadequate provision of mixed feed (score 4) were seen as the first and second important animal welfare issues, respectively. Participants agreed to discuss ways to address these priority issues in their next group meeting.
| Pair-wise ranking and scoring of animal welfare issues |
|---|
| Step 1 | Start by explaining the purpose of the exercise.
Ask one or two community helpers to create a matrix on the ground or chart paper. Have a minimum of six (6) rows and columns, with room to add more should the community identify more than five animal welfare issues. Have one of the community helpers draw a line from the top left diagonal corner to the bottom right diagonal corner. Cross out the boxes below the diagonal line to avoid duplication.
At the same time, ask the community to identify animal welfare issues that are common in the area. Have another community helper record them on cards. Use representative names, symbols, abbreviations, or locally available materials to depict the issues, such as different tree leaves. Make two sets of symbols for each identified issue. Place one set of names/symbols in the first column, from top to bottom. Then place the second set of names/symbols in the top row, from left to right.
Please note: It is the facilitator’s job to help the community reduce the number of animal welfare issues to a maximum of six to eight (6-8) that are most common to the community should they come up with a long list.
Please note: Ensure that you have multiple copies of the symbols to prepare for the prioritisation. |
| Step 2 | One by one, compare each name/symbol in the columns with each symbol in the rows. Encourage participants to discuss which animal welfare issues they would prioritise over the other and ask why. Have the community members place the preferred name/symbol in the relevant box in the matrix.
Please note: Coming to an agreement on the priority animal welfare issues may cause some debate amongst participants. These discussions are important as they generate understanding of the rationale underlying participant’s prioritisation of issues. As a facilitator, allow and encourage this discussion without inserting your ideas. Ask the community helper to record the reasons for their prioritisation. |
| Step 3 | Count the number of times each option appears in the matrix. Add them up and record totals at the bottom of the matrix using seeds, pebbles, or numbers (scoring). Then make a list of the options with the most prioritised animal welfare issue ranked first.
Once complete, consider using the following questions to generate a discussion about the results:
• Does everyone agree on the prioritised issues?
• What is the impact of the prioritised issues on animal-owning households? (e.g. livelihoods)
• What can be done to improve the prioritised animal welfare issues?
• Who needs to do what?
• What opportunities exist for participants to address the priority animal welfare issues and/or improve their current animal husbandry and management practices? |
| Step 4 | Summarize the results of the activity and have the community helper add any actions and activities to the community action plan. Agree on a date and time for the next session.
The matrix should be left with the community. Make a copy or take a photograph for your reference for future discussions and further action planning. Add a copy to your project action tracker. |
Facilitator’s notes: Pair-wise ranking & scoring of animal welfare issues
- If the number of items to be compared is too large, this exercise can become boring for participants. In this case, help participants to reduce the list by focusing on a smaller number of prioritised items.
- Make sure the animal welfare issues are very clear and precise. For example, if the community identifies water, clarify whether the issue of water is about water provision, water access/availability, water distance, etc.
- The discussions that people have about why they choose one option over another are just as important as the result. It is important to allow these discussions to happen. Take notes on the criteria participants use to decide on their priorities.
- Some diseases and conditions may be identified as a major animal welfare issue in the community, such as colic. These may also be included in the issues list.
- This activity might identify potential influencers. Consider involving them in to future sessions to help strengthen the identified opportunities for change.
Next steps
- Use understandings gained about what motivates animal-owning communities to inform the design of projects and/or strategies
- Priority issues agreed by the group for further exploration and/or action may be revisited during community action planning and included in relevant sections of the community action plan (e.g. issues and action sections)
- T26 Animal Welfare Cause and Effect Analysis to identify and promote understanding of the root causes of priority animal welfare issues and related implications for people and animals
T8b: Pairwise Ranking and Scoring of Animal Health Service Providers
This tool uses a matrix to make direct comparisons between animal diseases common to a community. It is used to prioritize animal diseases to address, which can be a useful next step after participatory welfare needs assessment (See T22 Animal Welfare Transect Walk) has been carried out. This tool is similar toT9 Matrix Ranking and Scoring in that it prioritizes diseases important to communities, however does so in a quicker and simpler way, without explicitly including criteria participants use when prioritizing issues. However, reasons for particular preferences can still emerge during discussions as participants decide on their priorities. As such, this tool may be used instead of, or before a more in-depth matrix ranking and scoring activity.
| Tool purpose: | Time needed: |
| • To support animal owning communities in identifying and prioritizing animal diseases to address. | 2 hours |
| Materials needed: |
| Coloured powder, chalk, stick, tree leaves, coloured cards; chart paper and markets, or other locally available materials to represent identified criteria |
Project Phase:
Initiation Phase, Implementation Phase
Approaches for Working With Communities:
Community Development Approach, Community Engagement Approach, Societal Outreach and Campaigns Approach
Behavioural Drivers (COM-B):
Behaviour Change Diagnosis and Planning
Project Support:
Participatory Learning and Action Tools, Needs Assessment, Gender Analysis
Pair-wise ranking and scoring of animal diseases
The matrix below compares common diseases in working animals and identifies which of them are perceived to be the biggest problem by the community. This activity helps people to understand the common diseases in their community and local area and can be used to inform the T26 Animal Welfare Cause and Effect Analysis.
T8B Pairwise scoring and ranking of animal diseases
A group of animal owners identified, compared and ranked six diseases, using tree leaves as symbols for respiratory problems, surra (trypanosomiasis – biting flies), worm infestation, ectoparasites, wounds and tetanus. This showed that tetanus was seen by the group to be the biggest welfare problem, followed by surra. Though worm infestation was initially identified as one of the most important diseases, it was found to be less important than other diseases during pair-wise comparisons. This tool was used to inform action planning and followed up with a T15 Cost-Benefit Analysis. The community decided to take up community-led vaccination of their animals against tetanus.
| Pair-wise ranking and scoring of animal diseases |
|---|
| Step 1 | Start by explaining that the purpose of the exercise.
Ask one or two community helpers to create a matrix on the ground using coloured powder, chalk, or a stick or on chart paper using markers. Have a minimum of six (6) rows and columns, with room to add more should the community identify more than five diseases. Have one of the community helpers draw a line from the top left diagonal corner to the bottom right diagonal corner. Cross out the boxes below the diagonal line to avoid duplication (see Figure T8b).
At the same time, start by asking the community to identify diseases that are commonly found in the area. Have another community helper record them on cards. Use representative names, symbols, abbreviations, or locally available materials to depict the diseases, such as different tree leaves. Make two sets of symbols for each identified disease. Place one set of names/symbols in the first column, from top to bottom. Then place the second set of names/symbols in the top row, from left to right.
Please note: Depending on the context, the participants may call refer to the diseases by local names and identify them by sign, symptom, effect and/or seasonality. The facilitator should have a good basic knowledge of diseases in the area to identify them.
Please note: It is the facilitator’s job to help the community reduce the number of diseases to a maximum of eight (8) should they come up with a long list. |
| Step 2 | One by one, compare each name/symbol in the columns with each symbol in the rows. Encourage participants to discuss which disease they would prioritise over the other and ask why. If a second facilitator is available, have him/her record the reasons for their prioritisation. If one is not available, remember to later record the reasons after the session.
Please note: Coming to an agreement on the priority diseases may cause some debate amongst participants.
These discussions are important as they generate understanding of the rationale underlying participant’s prioritisation of diseases. As a facilitator, allow and encourage this discussion without inserting your ideas.
Have the community members place the preferred name/symbol in the relevant box on the matrix |
| Step 3 | Count the number of times each option appears in the matrix. Add them up and record totals at the bottom of the matrix using seeds, pebbles, or numbers (scoring). Then make a list of the options with the most prioritised disease ranked first.
Once complete, consider using the following questions to generate a discussion about the results:
• Does everyone agree on the prioritised diseases?
• What is the impact of the prioritised diseases on animal-owning households? (e.g. livelihoods)
• If they have not been identified through the activity, ask what are current disease prevention and treatment practices?
• What can be done to prevent the prioritised diseases? |
| Step 4 | Summarize the results of the activity and have the community helper add any actions and activities to the community action plan. Agree on a date and time for the next session.
The matrix should be left with the community. Make a copy or take a photograph for your reference for future discussions and further action planning. Add a copy to your project action tracker. |
Facilitator’s notes: Pair-wise ranking
- If the number of diseases to be compared is too long, this exercise can be boring. In this case, help participants to reduce the list of by focusing on a smaller number of prioritised diseases.
- The discussions that people have about why they choose one option over another are just as important as the result. It is important to allow these discussions to happen. Take notes on the criteria participants use to decide on their priorities.
- Participants may not know the scientific names of diseases and will have local names for them. The facilitator should have basic knowledge of animal diseases when participants come up with signs, symptoms, effects and seasonality in order to identify them.
Next Steps
- Use understandings gained about what motivates animal owning communities’ to inform the design of projects and/or strategies
- Priority diseases agreed by the group for further exploration and/or action may be revisited during community action planning and/or included in relevant sections of the community action plan (e.g. issues and action sections)
- T26 Animal Welfare Cause and Effect Analysis to understand the root causes of priority animal diseases and related implications for people and animals
T8c: Pairwise Ranking and Scoring of Animal Diseases
This activity uses a matrix to make direct comparisons between resource and service providers. This tool is similar to matrix ranking and scoring (T9), as it prioritizes animal related resources and service providers important to communities, however does so in a quick and simple way, without including criteria participants use when prioritizing. However, reasons for their particular preferences can emerge during discussions between participants when priorities are debated.
| Tool purpose: | Time needed: |
• To support animal owning communities in identifying and prioritizing the local resource and service providers important to their animals’ welfare
• To identify types of resource and service providers the project can engage to support animal welfare improvements
• To generate peer-peer discussion and learning about the importance of different animal-related resources and services to their animals’ welfare in a process of self-sensitization towards understanding animal welfare needs | 1.5-2 hours |
| Materials needed: |
| Coloured powder, chalk, stick, tree leaves, coloured cards or other locally available materials to represent diseases, items and service providers |
Project Phase:
Planning Phase
Approaches for Working With Communities:
Community Development Approach, Community Engagement Approach
Project Support:
Participatory Learning and Action Tools, Needs Assessment
Specific Topics:
Animal Health and Services
Pair-wise ranking and scoring of animal-related resource & service providers
Pair-wise ranking and scoring may be used to analyze several aspects of resource and service providers, such as the importance of each on the welfare of animals, ranking of the quality, cost or availability of different providers (for example the veterinarians, animal health workers, feed, fodder and equipment sellers, etc.) or ranking several providers of the same service, such as the animal health workers in one locality.
T8c Pairwise ranking of resources and service providers in Halaba, Ethiopia
A group of animal owners scored and ranked animal-related resource and service providers in Halaba, Ethiopia, according to who they found most important for the welfare of their animal. They started by identifying the animal-related resource and service providers, including the farrier, the animal health service provider, the saddle maker, the shelter provider, the harness maker and the feed seller. The shelter provider, with whom they rent shelter space, was seen as the most important, as their animals are at risk at being attacked by hyenas at night. The shelter is important for preventing injury or death of animals. The second most priority animal-related service provider was the feed seller, as there is not enough available land and grass for grazing during the year since the area is highly prone to drought.
| Pair-wise ranking and scoring of animal-related resource and service providers |
|---|
| Step 1 | Start by explaining that the purpose of the exercise.
Ask one or two community helpers to create a matrix on the ground using coloured powder, chalk, or a stick or on chart paper using markers. Have a minimum of six (6) rows and columns, with room to add more should the community identify more than five criteria. Have one of the community helpers draw a line from the top left diagonal corner to the bottom right diagonal corner. Cross out the boxes below the diagonal line to avoid duplication (see Figure T8C).
At the same time, start by asking the community to identify the animal-related resource and service providers that are important for animals’ welfare. Have another community helper record them on cards or post-it notes. Use representative symbols, abbreviations, or locally available materials to depict the resource and service providers, such as different tree leaves. Make two sets of symbols for each identified resource and service provider. Place one set of symbols in the first column, from top to bottom. Then place the second set of symbols in the top row, from left to right.
Please note: It is the facilitator’s job to help the community reduce the number of resource and service providers to a maximum of eight (8) should they come up with a long list.
Please note: Ensure that you have multiple copies of the symbols to prepare for the prioritisation. |
| Step 2 | One by one, compare each symbol in the columns with each symbol in the rows. Encourage participants to discuss which resource or service provider they would prioritise over the other and ask why. If a second facilitator is available, have him/her record the reasons for their prioritisation. If one is not available, remember to later record the reasons after the session.
Please note: Coming to an agreement on the priority resource and service providers may cause some debate amongst participants. These discussions are important as they generate understanding of the rationale underlying participant’s prioritisation of resource and service providers. As a facilitator, allow and encourage this discussion without inserting your ideas.
Have the community members place the preferred symbol in the relevant box on the matrix. |
| Step 3 | Count the number of times each option appears in the matrix. Add them up and record totals at the bottom of the matrix using seeds, pebbles, or numbers (scoring). Then make a list of the options with the most-preferred option ranked first.
Once complete, consider using the following questions to generate a discussion about the results:
• Does everyone agree on the prioritised resource and service providers?
• Are you satisfied with the available resource and service provision?
Summarize the results of the activity and agree a time to schedule a follow-up session to undertake next steps as relevant to the context. |
| Step 4 | The matrix should be left with the community. Make a copy or take a photograph for your reference for future discussions and action planning. Add a copy to your project action tracker. |
Facilitator’s notes: Pair-wise ranking
- If the number of items being compared is too long, this exercise can be boring for participants. In this case, assist participants in reducing the list by focusing on a smaller number of prioritised service providers.
- The discussions that people have about why they choose one option over another are just as important as the result. It is important to allow these discussions to happen. Consider asking a second facilitator to join you in order to capture the information that comes from the discussion or document them yourself after your community visit.
- Depending on the context, , consider carrying out this activity separately between men and women or different groups of people in the project’s planning phase (e.g. owners, users, carers) and compare the results. Differences in the roles people play in animals’ lives and/or how they depend on their animals can influence how people prioritise choices. Discuss any differences in their responses and reasons for those differences.
- This activity might identify potential local service provider influencers. Consider involving them in to future sessions to help strengthen the identified opportunities for change.
Next Steps
Link to References Cited
QUICK LINKS
T9a: Matrix Ranking and Scoring of Animal Welfare Issues
T9b: Matrix Ranking and Scoring of Animal Service Providers
T9c: Matrix Ranking and Scoring of Sources of Credit
This PLA tool can support identification of community priorities related to a variety of topics, and you are encouraged to adapt the tool as needed to address topics relevant to your project. Step-by-step guidance for conducting this activity has been adapted from another matrix ranking/scoring tool for the following three topics: a) Animal Related Issues, b) Animal Service Providers, c) Sources of Credit [48].
T9a: Matrix Ranking and Scoring of Animal Welfare Issues
This tool uses a matrix diagram to compare animal-related issues based on community-identified reasons/criteria[1]. Matrix scoring and ranking differs from pair-wise scoring and ranking because it scores and ranks issues based on criteria agreed by participants during the exercise, rather than identifying priorities in relation to each other. This exercise enables participants and facilitators to identify priorities and gain a better understanding of the reasons underlying community’s preferences and choices and how the decision-making process happens within the group.
| Tool purpose: | Time needed: |
• To support animal owning communities in identifying their priority animal-related issues to address
• To identification of determining factors informing animal owning communities identification of priority issues.
• To understand differences in priority animal welfare issues and the criteria used to inform prioritization when activity conducted and results compared between different groups (owners/users/carers, men/women). | 2 hours |
| Materials needed: |
| chart paper, pens/markers or chalk/coloured dust, stones, pebbles, local materials (leaves, seeds, etc.) Pictures if available. |
Project Phase:
Planning Phase, Implementation Phase
Approaches for Working With Communities:
Community Development Approach, Community Engagement Approach
Stages of Change:
Contemplation Stage, Preparation Stage
Project Support:
Participatory Learning and Action Tools, Needs Assessment, Gender Analysis
Specific Topics:
Animal Husbandry and Management
Matrix ranking and scoring of animal-related issues
Matrix ranking and scoring can be used to identify and understand animal-related issues based on reasons/criteria agreed by participants. The tool can similarly be used with a greater focus on animal diseases specifically.
In the example below (Figure T9a), members of animal-owning households prioritized their working animal-related issues in terms of those felt to be most problematic, scoring each issues out of five and then ranking them. The group agreed to use frequency, severity/change of death, treatment cost, potential loss of work/income, challenging to treat to score and rank each issue. They agreed that 5 would be most serious/severe and 0 would be least serious/severe. The animal-related issue that had the highest cumulative score would be ranked as the number one priority, as it has the most severe consequences for the animal-owning households.
Figure T9a Matrix scoring and ranking of working animal-related issues
As a result of this exercise, participants identified lameness (19) as being the most significant issue, with colic (16) and hoof problems (16) were the second most important animal-related issues for the community. They decided to explore these issues further in their next session to understand the root causes.
| Scoring and Ranking of Animal-related Issues |
|---|
| Step 1 | Start by asking participants to prepare a list of animal-related issues. This could also be informed by previous discussions or tools. Alternatively, ask the group what animal-related issues can be or have been a problem in the past. It is important that the community come up with their own ideas and not be led by the facilitator. Ask the helper to draw a matrix and list the animal-related issues in the first column. |
| Step 2 | Ask the group which issues are most problematic and note the reasons why. Once the first reason is identified, encourage the group to think about other reasons. Try to group similar reasons together, such as loss of work and loss of income (Figure 9a). Have the helper add the reasons/criteria along the top row of the matrix. If there are too many criteria, encourage participants prioritise the most important ones.
Once identified, assist participants in framing the criteria as either all positive or all negative, which will keep scoring consistent and prevent confusion. For example, criteria related to cost may be framed positively as affordable or negatively as costly. Using both positive and negatively framed criteria together (e.g. easy to address (+), costly (-) might confuse the ranking or scoring process, by mixing high scores with negative meaning and positive meaning. In T9a example, 5 = serious/severe/problematic, while 0 = non-serious/mild/non-problematic. |
| Step 3 | Ask the group to score the animal-related issues listed in the first column against each of the criteria listed along the top row using up to five seeds or stones. Allow enough time for an in-depth discussion on the reasons for chosen scores and consensus reaching. Have the helper take notes for the reasons for choosing each score. |
| Step 4 | Once completed, ask the group to total each row (issues) based on the scores. Then rank the issues with the highest ranking = 1, next highest =2, and so on.
Facilitate the group to draw conclusions from the exercise by asking:
• Which issue (row) had the highest and lowest scores?
• Does everyone agree on the ranking?
• What were the reasons for these scoring decisions (if not already identified)?
• What is the significance of these scores to you?
• Which issues are the highest priority to address and why?
If participants express an interest in addressing their priority issues, encourage them to analyse the root causes or major contributing factors to their priority issues as a next step. |
| Step 5 | The matrix should be left with the community and prioritised issues added to a community action plan, which can be addressed later. Take a copy and add it to your project action tracker for future discussions and action planning |
Facilitation Notes
- Keep the group focused on the chosen topic, as this exercise has the potential to deviate from the original focus.
- Consciously or unconsciously, there may be a tendency for facilitators to include their own criteria, rather than those of the community. Encourage participants to come up with their own criteria and avoid inserting your own ideas. Some criteria may seem strange. If participants consider it important, it needs to be respected and rationale understood.
- Depending on the context, at the planning phase consider carrying out this activity separately between men and women or different groups of people (e.g. owners, users, carers) and compare the results. Differences in the roles people play in animals’ lives and/or how they depend on their animals to meet different needs can influence how people prioritize issues and make choices to act. Discuss any differences in their responses and reasons for those differences.
- Encourage participants to explore the root causes of welfare issues or challenges prior to planning actions; this will promote the identification of more effective and sustainable solutions. This can be part of discussions at the end of the activity or see next steps for recommended follow-up activities to support root cause analysis.
- Criteria should be either all positive or all negative: mixing positive and negative criteria can be confusing.
Next Steps
This activity can be followed by:
T9b: Matrix Ranking and Scoring of Animal Service Providers
This tool uses a matrix diagram to compare resource and service providers based on pre-determined criteria[1]. Matrix ranking and scoring differs from pair-wise ranking because it ranks or scores issues or items based on criteria agreed by participants during the exercise, rather than identifying priorities in relation to each other. This exercise enables participants and facilitators to identify priorities for animal-related resource and service providers and gain a better understanding of the reasons underlying community’s preferences and choices, and how the decision-making process happens within the group. Try to conduct this activity separately with owners, users and carers, including both men and women, or other relevant groups if they are likely to have different priorities.
| Tool purpose: | Time needed: |
• To identify priority resource and service providers
• To understand criteria animal-owning communities use to make choices in their use of resources and services
• To compare differences in animal and resource service provider priorities and the underlying rationales informing choices between different groups (e.g. men and women, owners/users/carers). | 2 hours |
| Materials needed: |
| Chart paper and markers or using sticks, stones, straw, local resources |
Project Phase:
Planning Phase, Implementation Phase
Approaches for Working With Communities:
Community Development Approach, Community Engagement Approach
Project Support:
Participatory Learning and Action Tools, Needs Assessment, Gender Analysis
Specific Topics:
Animal Health and Services
Matrix scoring of animal-related service providers
Service providers available in the locality are scored or ranked (see Figure T9b and T9c) against criteria participants identified as important to informing their use preferences. This exercise may be used to compare several providers of the same service (e.g. all the feed sellers) or may also be used to compare providers of different services (e.g. farrier vs agrovet vs community animal health worker etc.) Refer back to the results of T3 Venn diagram to understand the rationale for why participants rely on the animal resource and service providers. Consider using this activity to build upon the priorities identified in T8: Pairwise ranking of animal-related service and/or resource providers. However, the activity can be just as effective for prioritizing issues if used independently.
In the examples below, the services of five local animal health service providers were compared by participants within a community using a matrix scoring exercise.
Figure T9b Matrix scoring of preferences for local animal health service providers
Participants identified six criteria which they agreed were important to choosing a service provider: quality service, timely response, affordability, close proximity (distance), offers credit/repayment and friendliness/good relationship. They then scored each of the five service providers against each criteria using five seeds. Through a final discussion, participants decided to invite the prioritized health service provider to their next meeting to strengthen their relationships and negotiate a group rate for the service.
An example of the activity conducted using a ranking approach, rather than a scoring approach is also provided below for reference. The criteria are listed from top to bottom, with service providers listed from left to right. Participants were then asked to rank each service provider, against each of the criteria. The best service provider scored for the criteria was given a 1. Since there are five service providers, they would be ranked 1-5. In this example, some service providers were ranked equally and provided the same rank.
Figure T9c Matrix ranking of local animal health service providers
| Matrix Ranking and Scoring of Animal-related Service Providers |
|---|
| Step 1 | Ask participants to identify a list of resource or service providers commonly used. You may wish to refer to results from the T3 Venn diagram activity to help create the list of relevant animal-related resource and service providers for this discussion if available. |
| Step 2 | Next, ask participants to discuss which resource or service providers they prefer to use over others, and ask what their reasons for this preference are. Have participants list all the criteria they identify as informing their preferences for difference service providers. The group can add as many criteria as possible they feel necessary, although if there are many criteria listed, encourage participants to sort out which are the most important ones.
Once identified, assist participants to reframe the criteria as needed to ensure they are either all positive or all negative. For example, a criterion related to cost may be framed positively as affordable, or negatively as costly. It is important that all criteria used either be all positive, or all negative, to ensure consistency in scoring and avoid confusion that can result when calculating final scores or ranking at the end of the activity. |
| Step 3 | Matrix Scoring:
For matrix scoring, draw a matrix on the ground with the service providers listed from top to bottom in the first column, and the criteria informing preferences for use across the top row from left to right. Then ask participants use up to ten seeds or stones to score each service provider against each criterion.
Matrix Ranking:
For matrix ranking, rather than using seeds to score each service provider against each criterion, draw a matrix on the ground with the criteria listed from top to bottom in the first column, and the service providers for ranking across the top row from left to right. Ask the group to rank all the items based on the first criterion they have chosen. Then rank them all based on the second criterion and so on, until the full list of items has been compared against all the agreed criteria.
Allow enough time for in-depth discussion and analysis of the reasons for ranking or scoring and enough time to come to consensus. |
| Step 4 | When the ranking or scoring is complete, facilitate the group to draw conclusions from the exercise by asking questions.
The following guiding questions may be useful for facilitating this discussion:
• Who scored/ranked highest and lowest? Why?
• What is the significance of these scores to you?
• Do those results reflect the service providers you must rely on now? If not, why not?
• Are you satisfied that the providers you currently rely on are the best options for meeting the needs of you and your animal?
• Are there any issues preventing you from increasing your reliance on the high scored/ranking service providers? What would you suggest would need to be different to enable you rely on these service providers?
• How might you be able to better access or strengthen your relationship with these high scored/ranked service providers? |
| Step 5 | Any identified priority issues or actions can be added to the community action plan for later discussion and action planning. The matrix should be left with the community. Take a copy and add any actions to take or follow up on to your project action tracker for future reference and planning. |
Facilitation Notes
- It is very important that the facilitator keep the group focused on the chosen topic, as this exercise has the potential to deviate from the original focus.
- Consciously or unconsciously, there may be a tendency for facilitators to include their own criteria, rather than those of the community. Encourage participants to come up with their own criteria and avoid inserting your own ideas. Some criteria may seem strange. If participants consider it important, it needs to be respected and rationale understood.
- Depending on the context, at the planning phase consider carrying out this activity separately between men and women or different groups of people (e.g. owners, users, carers) and compare the results. Differences in the roles people play in animals’ lives and/or how they depend on their animals to meet different needs can influence how people prioritize issues and make choices to act. Discuss any differences in their responses and reasons for those differences. If this activity is carried about by a single gender group (men’s or women’s group), information gathered from this activity can help inform your gender analysis and planning.
- Encourage participants to explore the root causes of welfare issues or challenges prior to planning actions; this will promote the identification of more effective and sustainable solutions. This can be part of discussions at the end of the activity or see next steps for recommended follow-up activities to support root cause analysis.
- Criteria should be either all positive or all negative: mixing positive and negative criteria can be confusing.
- Facilitators must be clear about the specific topic being examined to keep the group focused.
Next Steps
T9c: Matrix Ranking and Scoring of Sources of Credit
This tool has been adapted from another matrix ranking/scoring tool to use a matrix diagram to compare sources of credit based on pre-determined criteria [48]. Matrix ranking and scoring differs from pair-wise ranking because it ranks or scores based on criteria agreed by participants during the exercise, rather than identifying priorities in relation to each other. This exercise enables participants and facilitators to identify priorities and gain a better understanding of the reasons underlying community’s preferences and choices for credit providers, and how the decision-making process happens. Try to conduct this activity separately with owners, users and carers, including both men and women, or other relevant groups if they are likely to have different priorities.
| Tool purpose: | Time needed: |
• To identify animal owning communities preferences for sources of credit and the criteria important to determining their priorities
• To generate motivation amongst animal owning communities members to form a community savings group to improve access and availability of financial resources to meet their household and animal needs
• To compare differences in priorities for sources of credit and the underlying rationales informing different groups’ priorities (e.g. men and women, owners/users/carers) | 2 hours |
| Materials needed: |
| Chart paper, pens/markers or chalk/coloured dust, stones, pebbles, local materials (leaves, seeds, etc.) |
Project Phase:
Planning Phase, Implementation Phase
Approaches for Working With Communities:
Community Development Approach
Behavioural Drivers (COM-B):
Opportunity
Project Support:
Participatory Learning and Action Tools, Needs Assessment, Gender Analysis
Specific Topics:
Livelihoods,
Group Formation / Strengthening
Matrix ranking and scoring of sources of credit
In this adaptation of the tool, different sources of credit can be analysed against agreed criteria that group members consider important to deciding which source of credit to use to borrow money. Rather than ranking across each criteria, this example ranked credit sources at the end, to allow participants to provide greater details they felt important to distinguishing between different sources of credit within the matrix itself. This exercise can also be used to motivate community members to form a self-help/savings group if one does not already exist.
T9d Scoring & ranking of different sources of credit
The credit source analysis was carried out with a self-help group in an animal-owning community. Upon completing the chart, the group revealed the following:
- Two guarantors are required for credit eligibility from money lenders and banks, whereas only one guarantor is required co-operative societies.
- Banks and co-operative societies require land as collateral to be eligible for loans, whereas money lenders do not require land - they accepting jewellery as collateral instead.
- Individuals can access interest-free loans from relatives.
- Money lenders have the highest interest rate (6%), but can provide loans very quickly.
- Banks and co-operative societies have a lower interest rate (3-4%), but the application and approval process takes a long time.
- Only loans from self-help groups offer a 1% return of interest, and also offer a relatively low rate of interest (2%) in comparison with money lenders, banks and cooperative societies, as well a quick turnaround for accessing money.
- Borrowing credit from money lenders and/or relatives can be high risk/stressful, as they often come with unrealistic timelines and heavy pressure to return money quickly, and are much less forgiving if repayment is late.
Through this exercise, the group realised that the best source of credit would be from a self-help group. This prompted the group to decide to establish a self-help group to start saving money together, so they could begin lending money amongst members to help meet the needs of their animals and families. As a result of establishing a savings groups, group members were able to being quickly accessing low-interest loans with low stress, the only condition for accessing loans from the group was that they had to be an official group member in good standing in terms of meeting the established savings contribution requirements.
| Analysis of sources of credit using ranking |
|---|
| Step 1 | Start by asking participants to discuss the different sources of credit and what is needed to access those sources. You can initiate the discussion by asking whom they might owe money to now or who they have borrowed from in the past. Draw a matrix either on the ground or on chart paper and list the sources of credit in a column. |
| Step 2 | Have the group discuss the reasons for choosing one source of credit over another. List the criteria considered when selecting a source of credit along the top row of the matrix.
Examples of selection criteria might include:
• Accessibility (ease of access)
• Eligibility or collateral required
• Interest rate charged
• Interest rate returned (from contributions to a savings group)
• Availability / timeliness of accessing loans
• Loan repayment flexibility (instalments vs one lump sum)
• Threat or stress associated paying back the loan
The group can add as many criteria as they feel are relevant. If there are many criteria listed, encourage participants to prioritise the most important ones. |
| Step 3 | Have the group fill in the matrix criteria for each source of credit.
Once identified, assist participants in framing the criteria as either all positive or all negative, which will keep scoring consistent and prevent confusion. For example, criteria related to accessibility may be framed positively as ‘ease of accesses, or negatively as ‘difficult to accesses. Using both positive and negatively framed criteria together e.g. easy to access (+), difficult to access (-) might confuse the ranking or scoring process, by mixing high scores with negative meaning and positive meaning. |
| Step 4 | Upon completion, ask the group to total each row based on the scores that they have assigned each criterion. If a self-help is identified as a credit option, consider ranking the sources of credit in addition to scoring. If a self-help group is not an option, it is not necessary to rank the sources of credit. In this case, it might be an appropriate time to introduce the option of a self-help group.
Then, have the group rank the scores if a self-help group was identified, with the number one (1) having the highest score, number two having the second (2) highest score and so on. |
| Step 5 | Ask the group to draw conclusions from the exercise by asking:
• What are some reasons for needing credit?
• Which sources of credit are used most often to meet your needs? Do you use any of these sources of credit to help you meet the needs of your animals as well e.g. to pay for health services, or purchase feed or equipment?
If have self-help groups have not been identified as a source of credit, then consider these discussion questions:
• Based on the criteria and the results of this exercise, are you satisfied that the sources of credit you currently rely on are the best options to meet your credit needs?
• What are the benefits of starting or joining a group like for example self-help group or animal welfare group or saving and credit cooperatives? |
| Step 6 | The matrix should be left with the community and opportunities to learn more about group formation and collective action activities added to a community action plan, which can be addressed later. Take a copy and add it to your project action tracker for future discussions and action planning. |
Facilitation Notes
- It is very important that the facilitator keep the group focused on the chosen topic, as this exercise has the potential to deviate from the original focus.
- Consciously or unconsciously, there may be a tendency for facilitators to include their own criteria, rather than those of the community. Encourage participants to come up with their own criteria and avoid inserting your own ideas. Some criteria may seem strange. If participants consider it important, it needs to be respected and rationale understood.
- Depending on the context, at the planning phase consider carrying out this activity separately between men and women or different groups of people (e.g. owners, users, carers) and compare the results. Differences in the roles people play in animals’ lives and/or how they depend on their animals to meet different needs can influence how people prioritize issues and make choices to act. Discuss any differences in their responses and reasons for those differences.
- Encourage participants to explore the root causes of welfare issues or challenges prior to planning actions; this will promote the identification of more effective and sustainable solutions. This can be part of discussions at the end of the activity or see next steps for recommended follow-up activities to support root cause analysis.
- Criteria should be either all positive or all negative: mixing positive and negative criteria can be confusing.
- Facilitators must be clear about the specific topic being examined to keep the group focused.
Next Steps
- This activity can be followed by T15 Cost-Benefit Analysis to explore the costs and benefits to people and animals of different solutions to credit sources, including alternative sources, thereby helping to generate motivation to take action.
- Use understandings gained about what motivates animal owning communities to inform the design of projects and/or strategies.
Link to References Cited
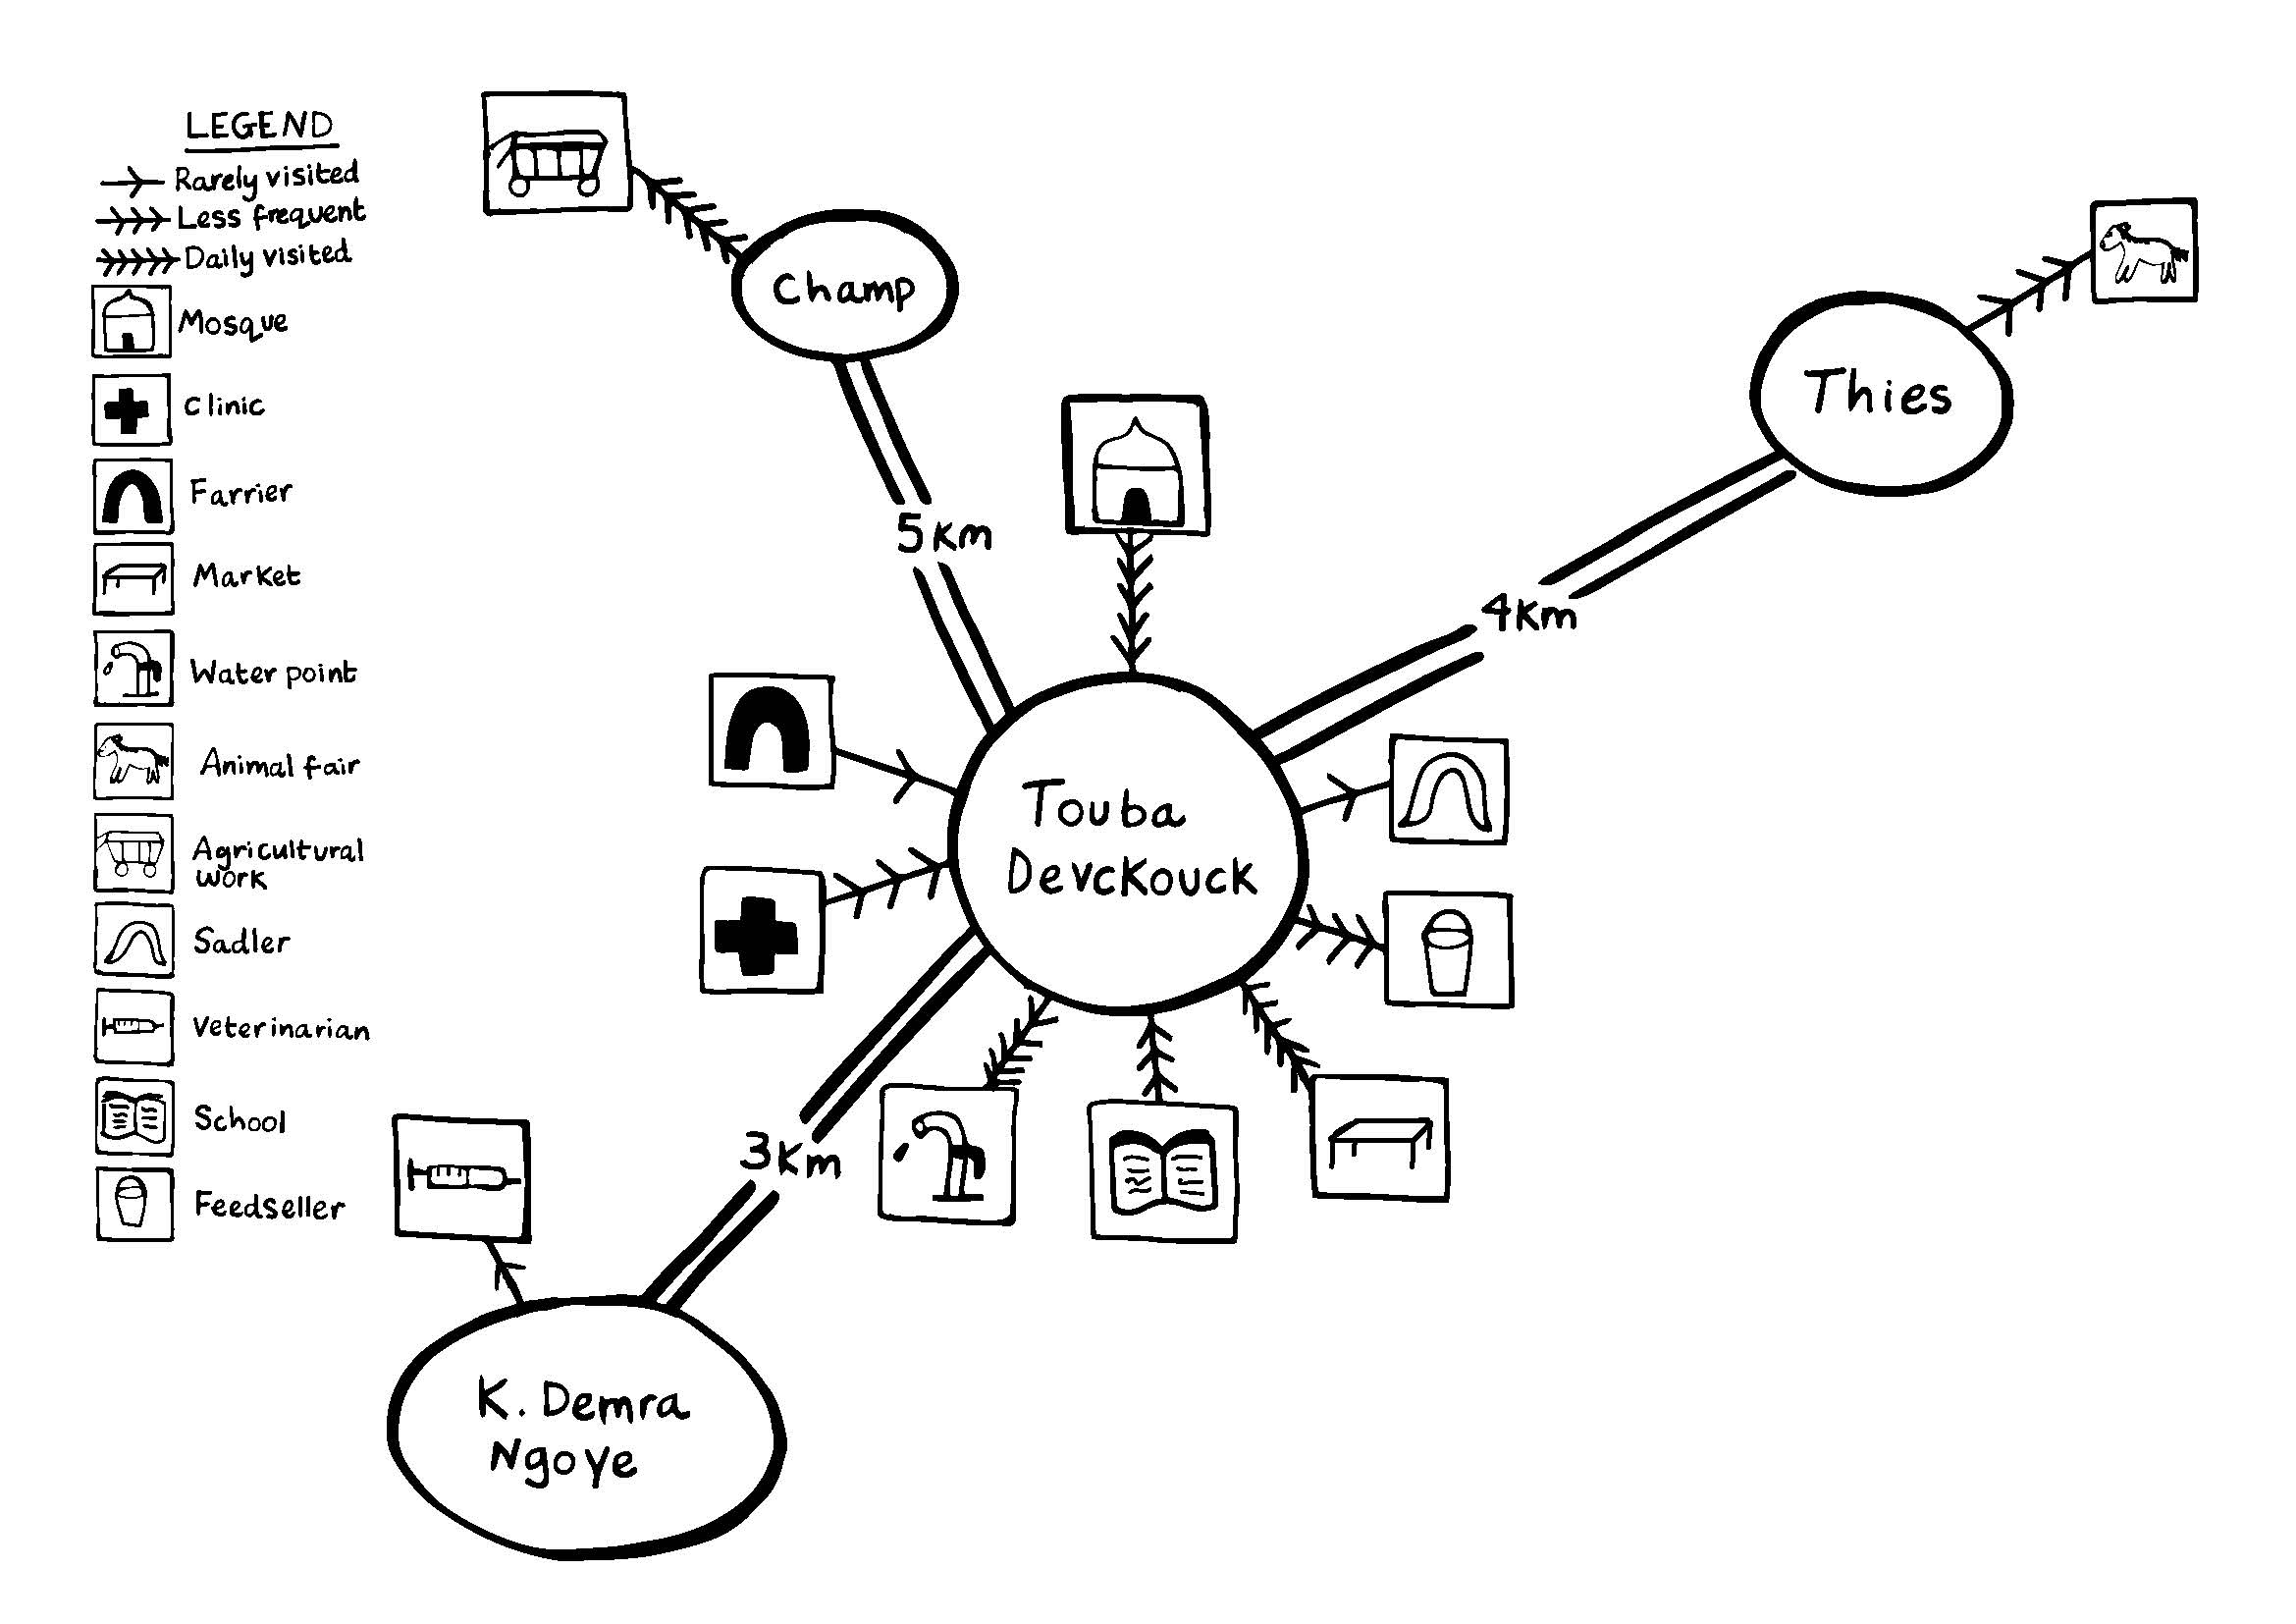
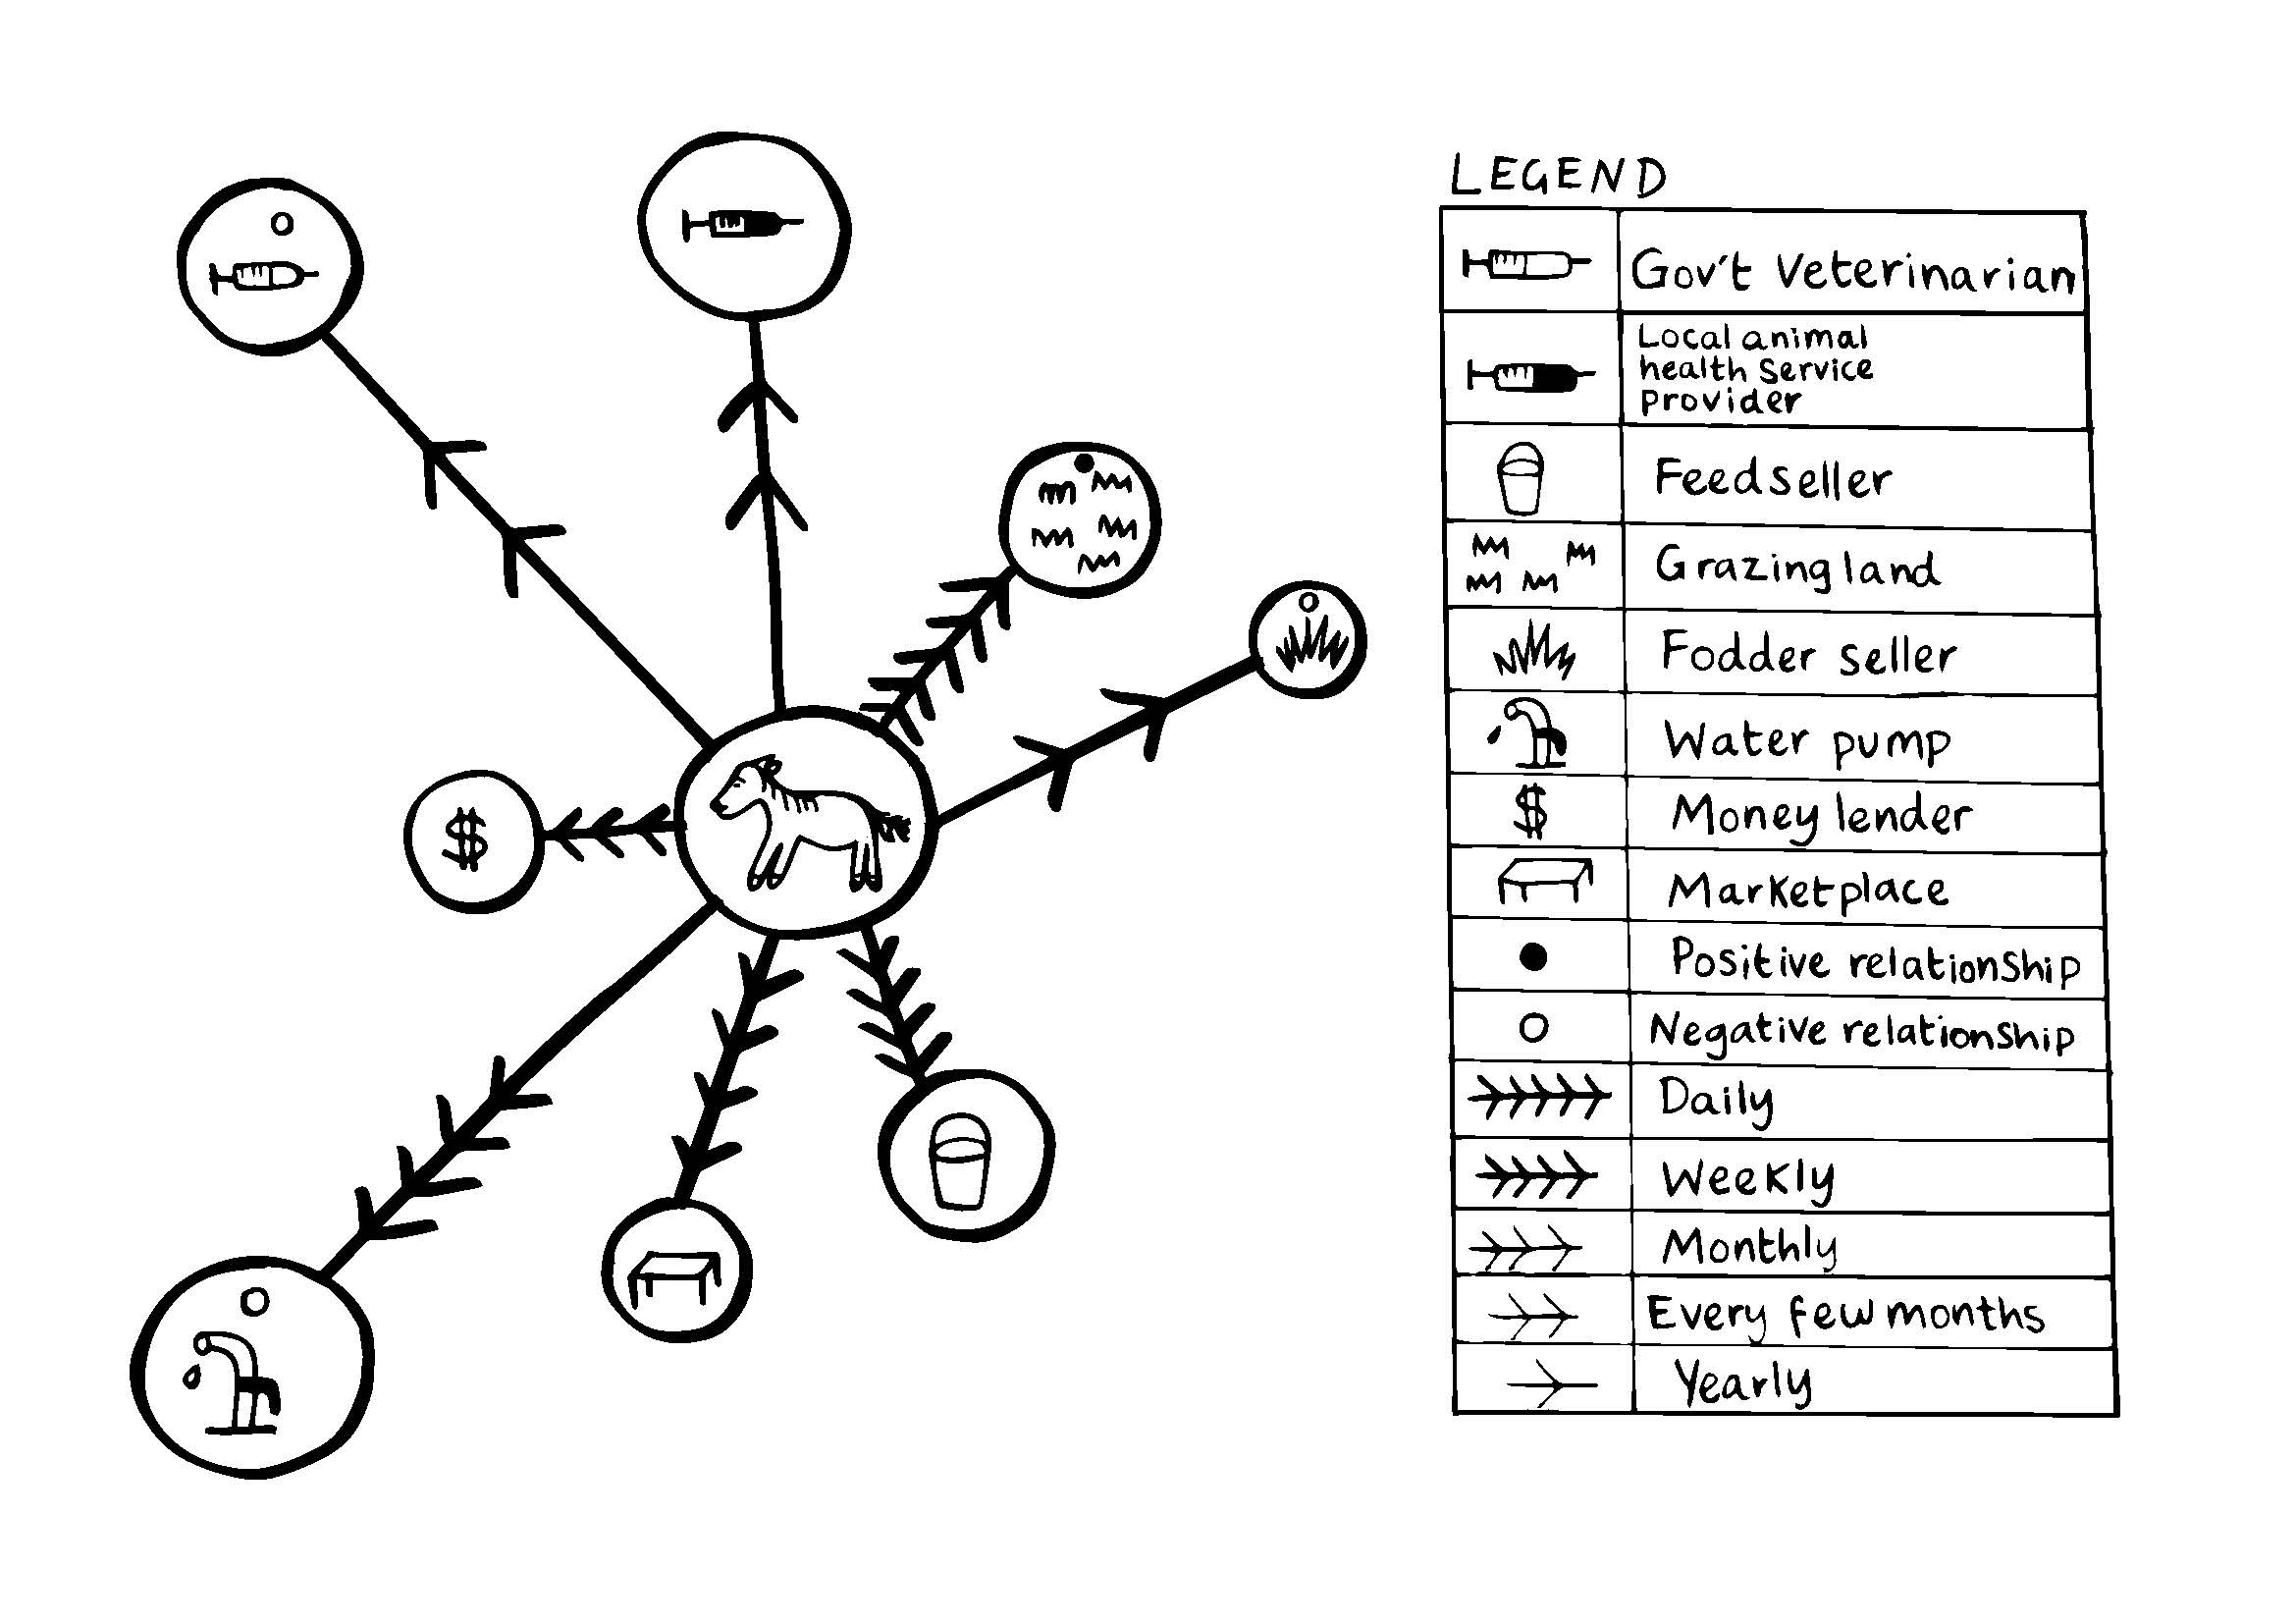
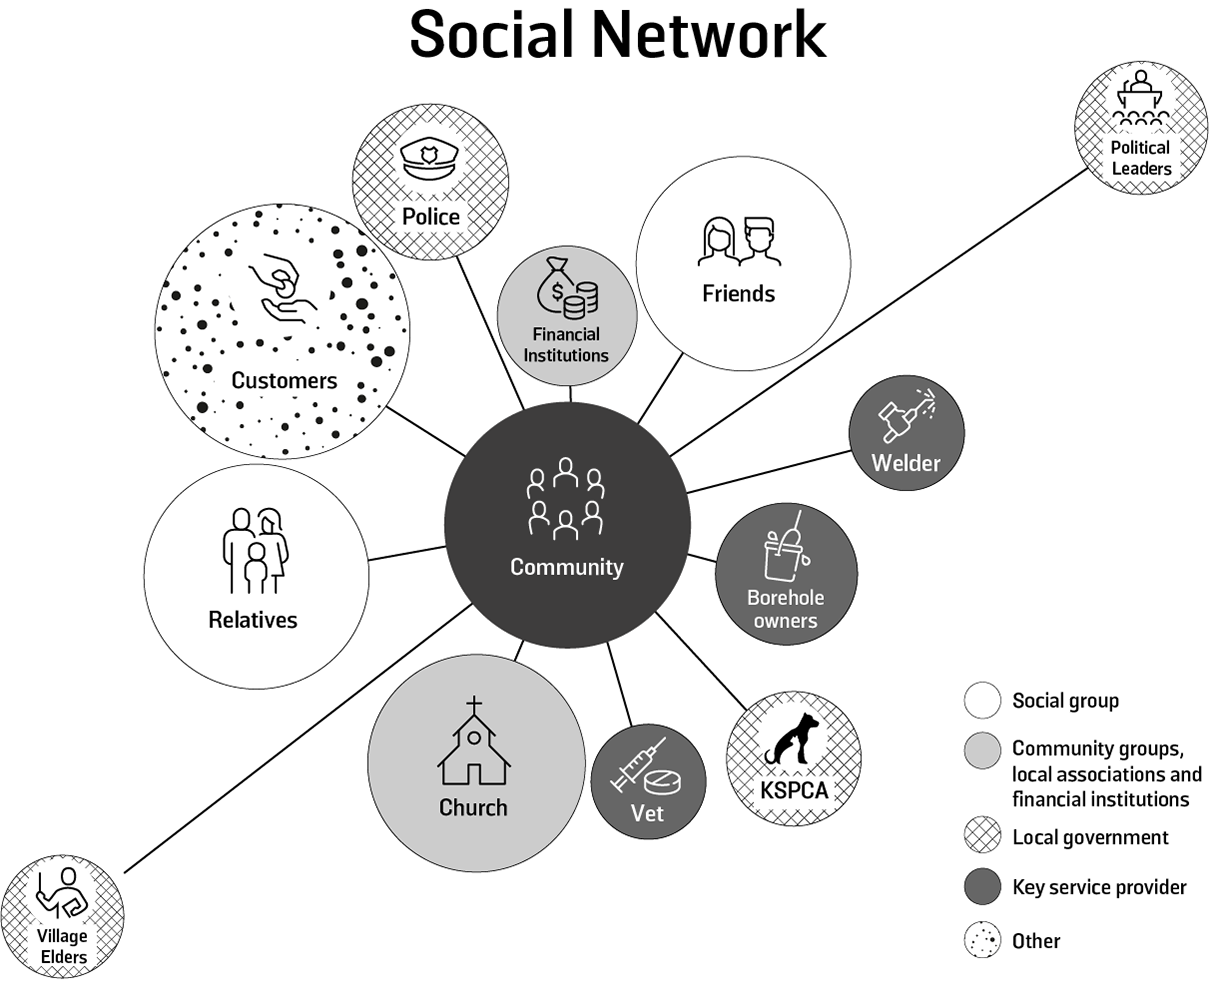


![Figure 26: The spectrum of community participation and its relationship to the three C4A approaches for working with communities [44]](http://communitiesforanimals.thebrooke.org/wp-content/uploads/2021/03/A19-Spectrum-Complete.png)


![Figure 28: Gender Equality Continuum with Examples from Animal Welfare Improvement Projects [56]](http://communitiesforanimals.thebrooke.org/wp-content/uploads/2021/04/A20-Gender-Complete.png)