QUICK LINKS
T2 Mobility Map Resources and Services
T2 Location of Services and Resources
T2 Facilitator's NOTES
T2 NEXT STEPS
T2: Mobility Map Resources and Services
A mobility map is a diagram showing the movement of people around their locality and their reasons for moving. This map has been adapted specifically to enable examine movement patterns of working animals, including where people go with their animals, why they go there, socially differentiated mobility and access to animal-related resources and services [48]. Mobility maps can begin analysis of the impact of movement on the welfare of working animals and implications of mobility patterns on people’s lives, in terms of labour burdens and livelihoods.
| Tool purpose: | Time needed: |
| • To understand where working animals and their owners, users and cares travel, distances travelled, travel time and frequency of visits • To understand the frequency that animal-related resources and services are accessed and potential physical barriers to accessing them • To identify potential mobility patterns negatively contributing to working animal welfare • To understand the implications of socially differentiated mobility on working animal welfare, and the associated livelihoods and labour burdens of animal owners, users and carers of both sexes when conducted and responses compared between different social groups. | 1.5 hours per map |
| Materials needed: | |
| Chart paper, note cards, markers, or other locally available resources, like sticks, stones, straw, beans, seeds, coloured powders or saw dust, etc. |
Keyword Search Tags
Project Phase:
Initiation Phase
Approaches for Working With Communities:
Community Development Approach, Community Engagement Approach
Behavioural Drivers (COM-B):
Behaviour Change Diagnosis and Planning
Project Support:
Participatory Learning and Action Tools, Needs Assessment, Gender Analysis
Location of Services and Resources
Mobility maps usually highlight the accessibility/location and of availability of services and resources, movement of working animals to and from their places of work and other commonly visited destinations, and the related distances travelled to reach them and who uses them during these times/travels. This map can also capture the distances to various animal-related services and resources, the frequency of visits and the time required for a visit. For example a mobility map could detail the distance and associated time needed to travel for veterinary care, repair harnesses, collect animal feed, take animals to water or graze, and visit other destinations, such as animal fairs or markets.
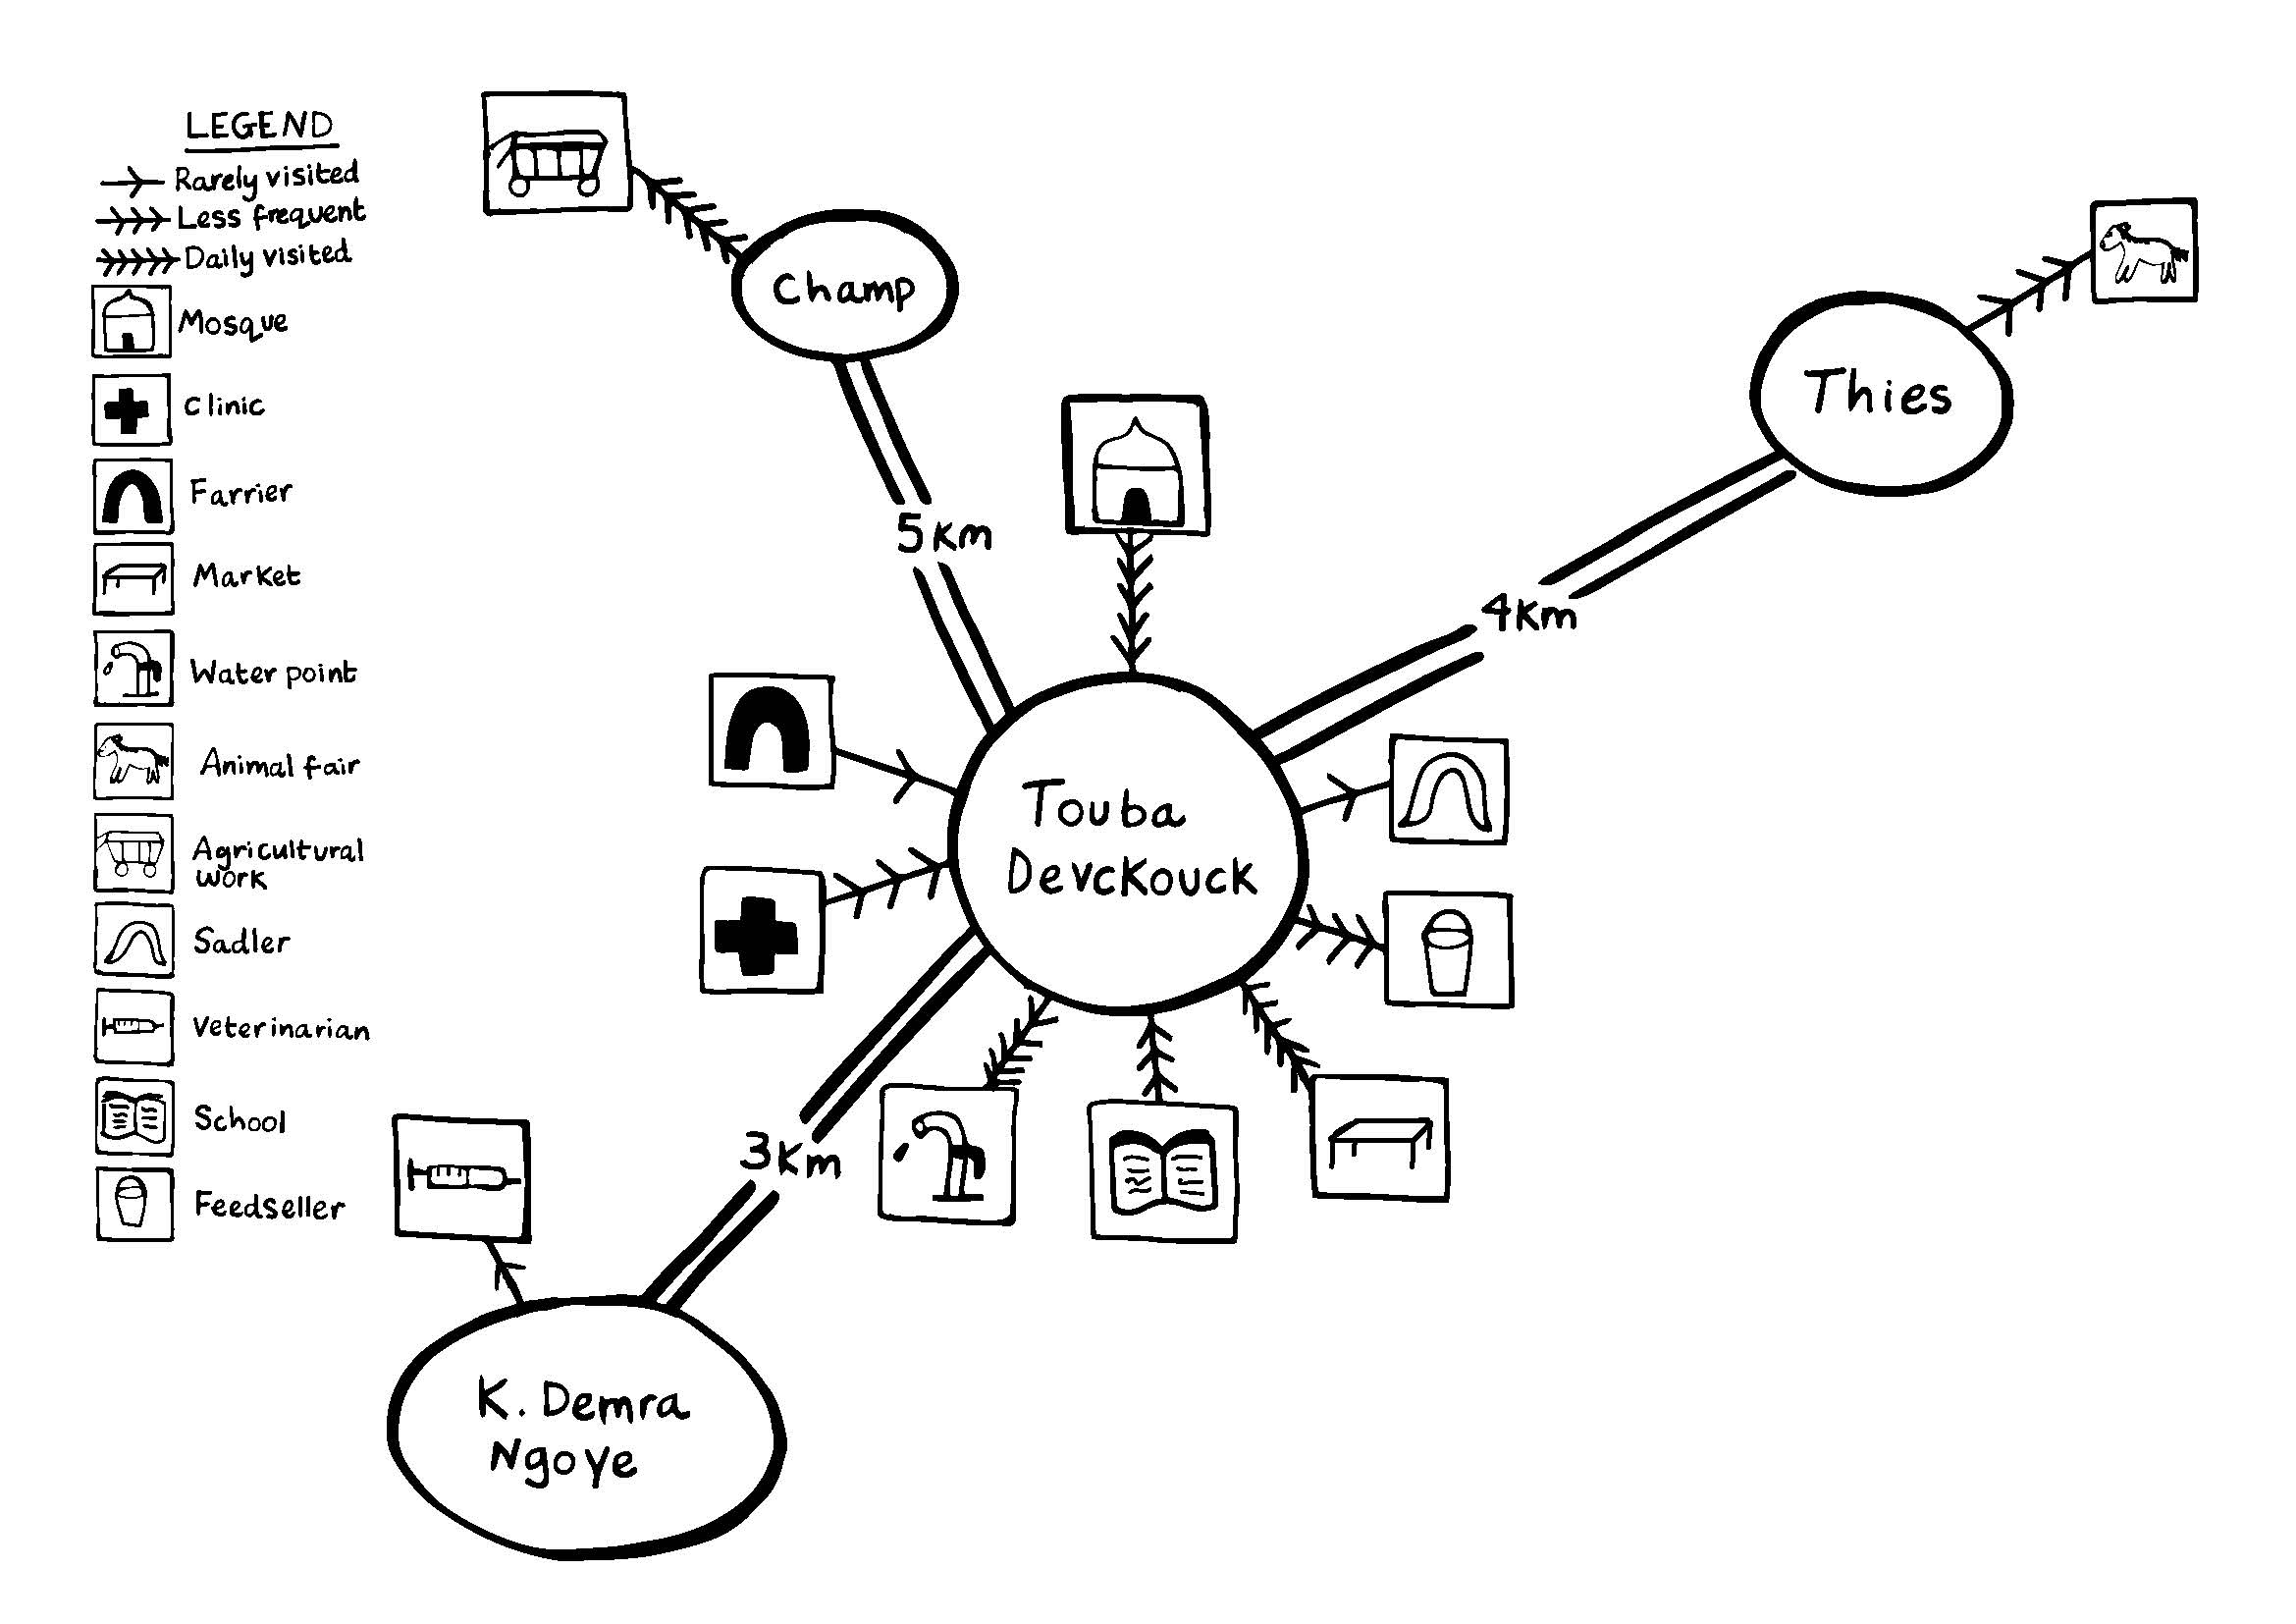
Figure T2 Mobility map created by a community in Senegal
The mobility map was drawn by a group of working animal-owning farmers. It shows that most movements are made within Touba Devckovek, but Thies and K. Demra Ngoye are also visited. The double lines represent main roads. Thin lines with arrows represent the frequency of visits.
| Mobility Mapping | |
|---|---|
| Step 1 | Start by explaining the purpose of the exercise and then ask participants about all the places they visit within and outside the community with their working animals. Ask the helper to record all the places and destinations travelled by community members with their working animals on cards or a sheet of paper using words or symbols. Examples of places/destinations may include: • Workplaces • Resource centres (e.g. equipment, tools, agricultural supply) • Markets (e.g. human and/or animal feed) • Water points (e.g. well, borehole) • Service providers (e.g. doctor, veterinarian etc.) • Religious places (e.g. mosque, church, synagogue) • Animal fairs or far-away trading destinations • Migratory workplaces • Places of social importance/gathering (e.g. visiting relatives, meeting places, places of significance for celebrations) • Other communities or towns |
| Step 2 | Ask participants to then draw a map on the ground or on a large piece of chart paper with the community at the centre. Then have participants add the places and destinations identified in step 1 to the map relative to the communities and villages. Then have them draw major roads and access routes. Major roads are represented by a double line in the T2 example, with labels to inform the distances between each major community. Ask the group to discuss the frequency of visits, reasons for travel, the distances and the time spent travelling. In the example (figure T2), places visited daily are represented by a line with five arrows on it, while those visited less frequently are represented by three arrows and those visited rarely are represented by one arrow. |
| Step 3 | Encourage the group to analyse and discuss what is shown on the mobility map. Consider using the following guiding questions: • Which regularly visited destinations require the most time to reach and why? (e.g. road condition or distance) • Who does this burden of travel time commitment fall to? Is it shared equally between men and women owner, carers, and/or users? Why or why not? • Which routes or movements are perceived to negatively affect the animals’ welfare and why? For example, which routes are the heaviest loads carried, which routes put animals at the highest risk of injury? • Are there any potential physical or social constraints affecting people’s mobility (e.g. are certain places only accessible for certain groups e.g. men or women, variability in market times or availability of veterinary services)? • What are the implications of different people’s mobility on the lives of working animals and their own lives (e.g. livelihoods, time, or labour burdens)? What could be done to address any mobility issues identified to be impacting the lives of working animals and their own lives? |
| Step 4 | Record any identified mobility patterns or issues which if addressed could improve working animal welfare to your project action tracker and follow up with the community later if/when you start action planning together. |
Facilitator’s Notes
- Ideally, mapping is carried out on the ground, so that everyone can walk around the map and see it from different angles. This will allow a large crowd to view the map and contribute to it.
- Different participants may draw different maps of the same area, which may reflect their different views of the community and places/routes of importance. Consider asking men and women, and owners and carers of animals to participate in this activity. You may wish to use different colour markers, string, stones /beans/stickers to represent the different categories of participants. Alternatively, consider doing this activity separately amongst women and men, especially if it is not culturally appropriate for men and women to do the activity together. If conducted separately, try to have the two groups come together at the end of each exercise to compare the maps and discuss reasons for any differences as time and local context permits.
- Remember that you are not controlling the map. Give confidence to people so that they gradually take over the entire process themselves and encourage those who are not participating.
- If the facilitator notices that different social groups have identified different mobility patterns, it should be noted into your project action tracker.
Next Steps
Consider following this activity up with one or more of the following tools to build upon discussions resulting from this exercise:
- T3 Venn diagram: Resource & Services to more deeply examine resource and service providers, including preferences, satisfaction and gaps.
- T4 Daily Activity Schedule to understand how people and animals in animal-owning communities spend their time.
- T5 Gender Roles & Responsibilities to understand men’s and women’s roles in caregiving, and using and caring for animals.
- T6 Seasonal Calendar to further understand seasonal patterns, activities, resource availability, and vulnerability risks.
- T11a Changing Trend Analysis to reflect on changes to the lives of animals and animal-owning households over time and generate discussion and motivation to address causes of negative changes perceived.