QUICK LINKS
T13 Income, expenditure and credit analysis resources and services
analysis of income, expenditure and credit by animal owners
T13 Facilitator Notes
T13 Next Steps
T13: Income, Expenditure and Credit Analysis
A credit analysis examines existing sources of income, expenditure and credit. This motivational tool is primarily used during planning to generate interest in establishing a self-help or savings group to promote collective action. If group savings is not appropriate or part of the local culture, this tool is great for promoting the benefits of collective action to reduce common expenditures, such as animal feed or veterinary treatments.
| Tool purpose: | Time needed: |
| • To generate interest in establishing a self-help group through collective regular savings and loaning activities. • To identify the coping strategies undertaken to meet household and animal needs. • To understand the advantages and disadvantages of credit sources and their impacts on animal welfare and people’s livelihoods. • To identify opportunities for collective action to reduce common community-wide expenditures. • To support a gender analysis during a participatory needs assessment to identify perceived differences in income, expenditure and credit between men and women. | 1.5 - 2 hours |
| Materials needed: | |
| Chart paper, cards & pens, or coloured chalk and other local resources that represent each source of income, expenditure and credit. |
Keyword Search Tags
Project Phase:
Planning Phase, Implementation Phase
Approaches for Working With Communities:
Community Development Approach
Behavioural Drivers (COM-B):
Opportunity
Project Support:
Participatory Learning and Action Tools, Needs Assessment, Gender Analysis
Specific Topics:
Livelihoods, Group Formation / Strengthening
Income, expenditure & credit analysis
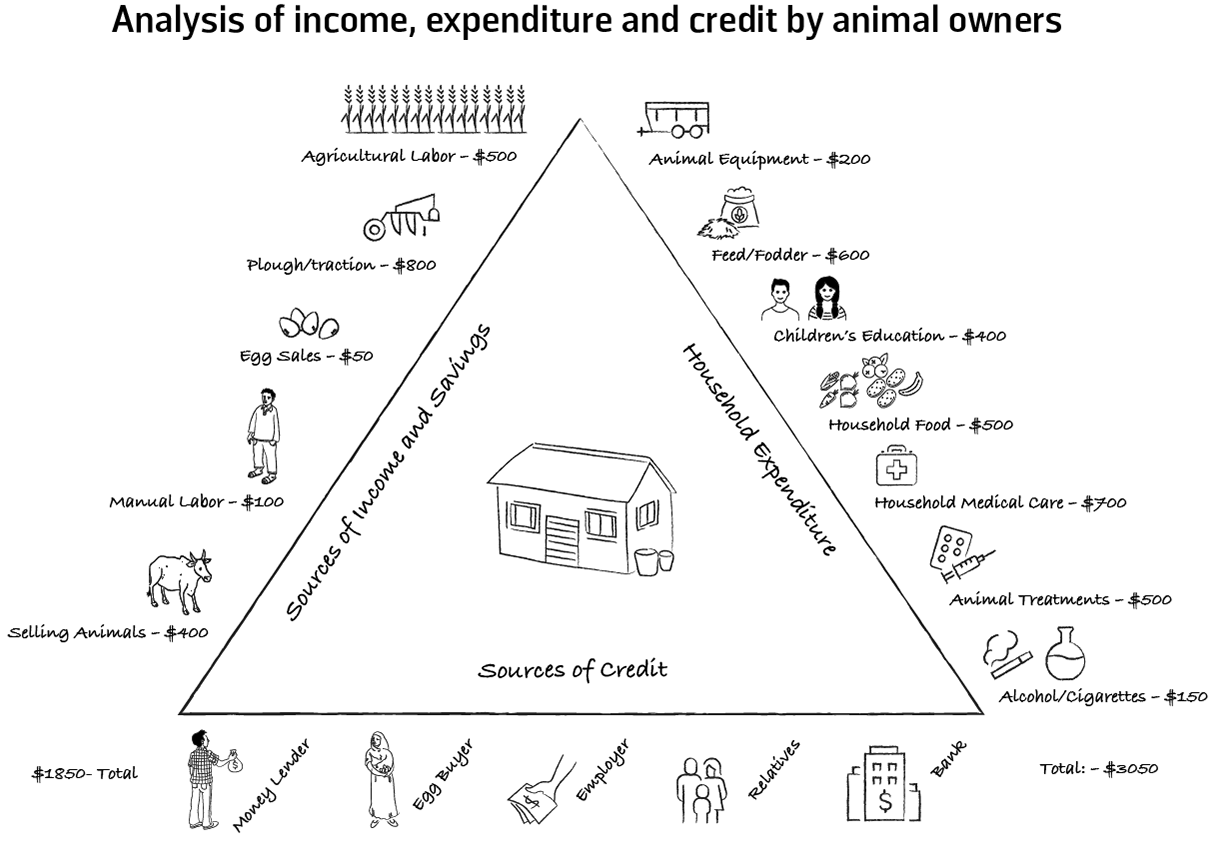
Figure T13 Analysis of income, expenditure and credit by animal owners
The figure above (T13) shows an income, expenditure and credit analysis carried out by members of animal-owning households in a community. In this example, participants were asked to allocate an estimated annual amount per household for each source of income and expenditure. They also identified where they were able to find credit when income is less than expenditure.
The diagram illustrates:
- Most animal owners earn their main income through work with their animals using plough and traction ($800).
- Additional income comes from agricultural labour ($500), selling animals ($400), manual labour ($100) and selling eggs ($50).
- The major household expenditures are household medical treatment and health care ($700), animal feed and fodder ($600), human food ($500) and animal health treatments ($500).
- Other household expenses include children’s education ($400), and animal’s equipment ($200) and alcohol and cigarettes ($150).
- Many animal owners are dependent on credit from employers, the local money lender, relatives or the egg buyer.
The discussion during this exercise led the group to start their own savings fund in order to support their animal-related and household needs and reduce their dependency on high interest loans from money lenders.
| Income, Expenditure and Credit Analysis | |
|---|---|
| Step 1 | Start by explaining the purpose of the activity and ask a community helper to draw a large triangle, either on the ground or on a large piece of chart paper. Label the left side ‘income’ and the right side ‘expenditure’. Draw arrows facing into the triangle for income and out of the triangle for expenditure (see figure T13). |
| Step 2 | Ask participants about their various sources of annual household income. Encourage them to describe all the types, not only cash, but payments in kind (such as food, handmade goods, or other resources). Urge participants to recall both regular (daily, weekly, monthly) and seasonal income. If this activity is conducted by men and women separately, make sure that they include income from all family members. Have the helper write each source of income on individual cards using words or symbols and have participants align the cards along the outer left-hand side of the triangle. |
| Step 3 | Have the group discuss and agree on their common major household expenditures, including animal-related expenditures. Remind them to include big items that might not be regular expenditures, such as household construction and renovations, gifts for family members and wedding expenses. Have the community helper write each source of expenditure on individual cards using words or symbols and ask participants to place the cards along the right-hand side of the triangle. |
| Step 4 | Ask the participants to provide an estimated average annual amount for each source of income and have the helper add the amount to each card. Then, ask the group to provide an estimated average annual amount for each household expenditure and have the helper add the amount to each card. |
| Step 5 | Total the average annual income with the participants and have the helper write it on the triangle in the bottom left-hand corner (below all the income source cards). Total the average annual expenditure with the participants and have the helper write it on the triangle in the bottom right-hand corner (below all the expenditure cards) (see figure T13). |
| Step 6 | Once income and expenditure have been totalled, compare the total average income with total average expenditure. If expenditures appear to be more than income, ask the participants what they do to cover the costs of expenditures that income does not cover. What do you do during a period of emergency or when unexpected costs arise (health care, gifts, ceremonies, etc.) to meet the needs of your households and animals? (Coping strategies) |
| Step 7 | Ask participants to describe and list their various sources of credit. Have the helper write the credit sources on cards and place them along the bottom of the triangle (see figure T13). Participants may identify reasons for selecting specific sources of credit, such as: • ease of access • interest payments • loan repayment terms • threats and pressure (from family/friends) • the need for a guarantor • collateral and mortgage terms |
| Step 8 | Once the triangle is complete, ask the group: • How can you reduce common expenditures? • What are some potential collective action activities? • Why do you prefer one source of credit over another? • What are the negative implications of continuous borrowing on your own lives and your animals’? • Are there alternative options that would have less consequences or impacts? |
| Step 9 | Record any actions the group agrees (e.g. establishing a self-help group, starting their own savings group, opportunities to take collective action to reduce expenditures) to the community action plan. For those interested in setting up a savings and/or self-help group, set a date and time to meet soon to ensure that interest is not lost. Record actions to be taken by the team in your project action tracker and support the community by linking them to any necessary stakeholders. |
Facilitator’s notes: Income, expenditure and credit analysis
- The primary purpose of this tool is to generate interest in group formation. If you know that a savings/self-help group already exists, it might be more appropriate to use another tool such as T9 Matrix Ranking and Scoring (T9c credit matrix ranking and scoring) for group strengthening or T15 cost-benefit analysis to initiate collective action.
- For some groups this might be a sensitive discussion. Trust is important between community members before they will have an open discussion on income, expenditure and credit, thus, it is essential to have a good understanding of the trust between participants before conducting this activity.
- Decide the group dynamics ahead of time and whether it would be best carried out with men and women (or other subgroups) separately or in a mixed group. This will depend on your rapport with the community, culture and local gender dynamics.
- If conducted separately between men and women, consider bringing the two groups back together at the end of the activity to review the results of each chart and resolve any differences if time allows.
- If it is not appropriate to conduct this activity with men and women together in the local context, or if it could prohibit participation and freedom of discussion, consider conducting this activity separately.
- This tool may support gender analysis when conducted separately with men and women, by enabling communities to identify and compare differences in perceptions of sources of income, expenditure and credit, total estimated amounts of each and the advantages and disadvantages of each source of credit. The facilitator job is to help participants explore why these differences exist, how they help or hinder them from meeting their own and their animals’ needs and identify actions to address the differences.
Next Steps
- This tool is predominantly used for action planning. Consider following this activity up with another credit analysis tool, such as T9 Matrix Ranking and Scoring (T9c credit matrix ranking and scoring) for group strengthening or T15 Cost-Benefit Analysis to initiate collective action.
- Once the group has identified potential for alternative credit options, follow up with them to see if they any require further support. This might include linking the group to other programmes, or guiding them to the appropriate organisations, agencies, schemes etc.
- If the group has shown interest in forming a self-help or savings group for collective action, follow this activity up with a session on forming and sustaining a group. Do not let much time pass between this activity and the next meeting or else the community might lose the momentum and enthusiasm for forming a group.
- If the community has only come up with sources of income, this might be an opportunity to explore other income generation activities with the group if there is interest.
Tool adapted from: FAO Income & expenditure matrix