QUICK LINKS
T1a: Mapping resources and services
T1b: Mapping Animal Welfare Issues
T1c: Mapping Animal Diseases
T1a: Mapping Resources and Services
Most communities are not accustomed to being asked for their expertise. Mapping is a great first tool to begin with because it gets the communication and discussion going between you and the community. Local people are rich in knowledge and understanding about their own environment and surroundings, as this is where their families have lived often for generations, so maps drawl by the local community are usually detailed, authentic and accurate.
This particular map is a visual representation of the important places, services and resources in the area, as seen and understood and perceived by the community at the present moment. The map will include houses, roads, basic infrastructure, working places, natural resources, and specific resource and service locations.
| Tool purpose: | Time needed: |
| • To understand which resources and services are most important to the community • To understand the power dynamics surrounding resources within the community – who owns/controls the resources • To identify gaps in available resources and services | 2 hours per map |
| Materials needed: | |
| Chart paper, note cards, markers or other locally available resources, like sticks, stones, straw, beans, seeds, coloured powders or saw dust, etc. |
Keyword Search Tags
Project Phase:
Initiation Phase
Approaches for Working With Communities:
Community Development Approach, Community Engagement Approach
Behavioural Drivers (COM-B):
Behaviour Change Diagnosis and Planning
Project Support:
Participatory Learning and Action Tools, Needs Assessment, Gender Analysis
Specific Topics:
Animal Health and Services
Resources and Services Map
The map below illustrates the community’s own village and environment. It includes infrastructure, such as houses, roads, drinking water facilities, working places and natural resources, as well as resources related to working animals such as grazing land, resting, feeding, and watering areas. It identifies which places and people are important to the community, including those that affect the care of their animals, such as the location of feed sellers, veterinarians, agro vets, and clinics.
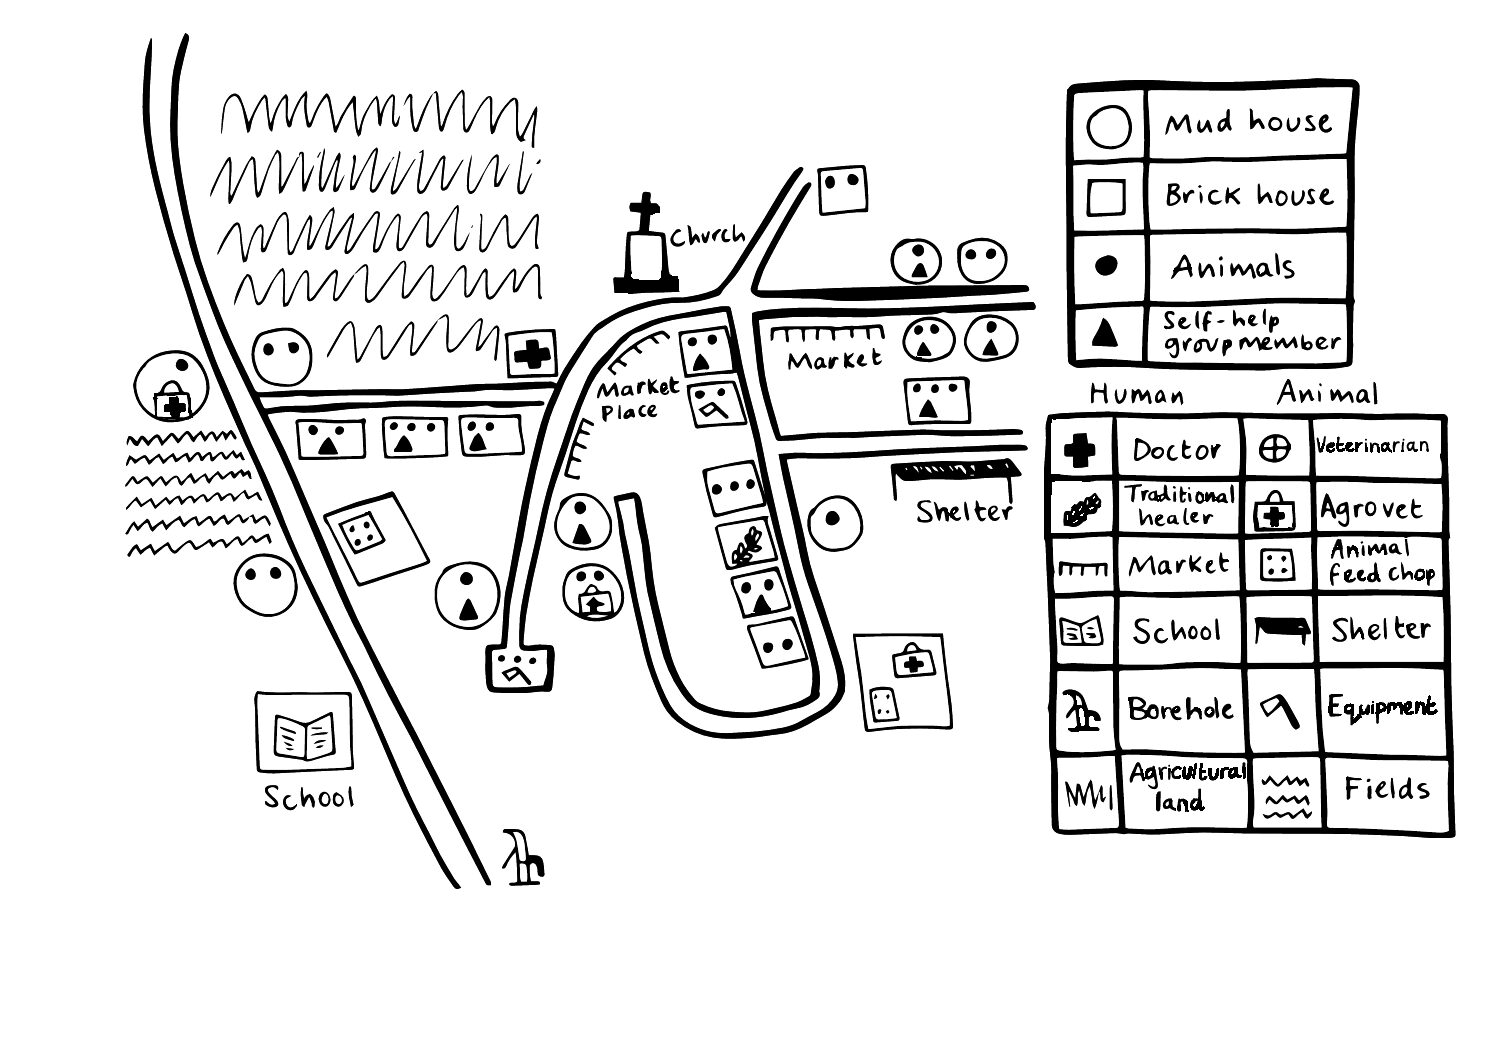
Figure T1A Resources & services map for a rural agricultural community
Once a village outline had been drawn, the group added the number of animals per household (black dots). Human and animal-related resources and service providers are shown in the legend and include the doctor, school, seed sellers (human); veterinarian, animal feed seller, agro-vet (animal); and borehole (both). In this map, the veterinarian and the borehole are both located on the outskirts of the community and this likely has implications for their daily activities.
Discussions during and after production of the map may focus on the availability, cost and quality of the resources and service providers available in the village.
| Resources and Services Map | |
|---|---|
| Step 1 | Start by explaining the purpose of the exercise and ask participants to draw an outline of their community on the ground or a large piece of chart paper using local materials, including: • General infrastructure, such as roads and paths, water points, community feed storage • Households in the community, including details of each household’s family members • Important, well-known places, such as clinic, school, temple/mosque, and meeting places |
| Step 2 | Ask participants to indicate households that have working animals. Show the types and numbers of animals using symbols or local materials. Add details such as whether the animals are male or female (e.g. blue for males, red for females) and the kinds of work they do. |
| Step 3 | Ask participants to identify any animal-related resources or services that are available in the community and add them to the map: • Natural resources, such as animal water supplies, resting areas and grazing areas and/or land where feed is grown • Service providers, such as animal health service providers, animal equipment makers, feed sellers, livestock extension workers etc. |
| Step 4 | Ask participants to identify any human-related resources and services that are available in the community and add them to the map: • Natural resources, such as agricultural land, communal land, forest areas, water sources, resting and social areas • Service providers, such as doctors, traditional healers, schools, shops, banks, money lenders, community-based organizations working on animal welfare Ask participants if there is anything else that they would like to show on the map that they think is important to any aspect of their lives or livelihoods. |
| Step 5 | Encourage the group to analyse and discuss what is shown on the map. Consider using the following guiding questions: • Which resources and services are most important and/or used most frequently? Not at all? Why? • Availability and access to resources and services – which are most available, and which are lacking? Who has access and who doesn’t? Why? • Who owns and/or makes the main decisions about land, water and other important or communal resources? • Are there differences in access or availability of these important assets between men, women, youth, and different ethnic, religious or socioeconomic groups? • Quality and cost of available resources and services, noting different people’s views • Which resources degrade and which improve? |
| Step 6 | If the map was drawn on the ground, document it by either transferring it to a piece of paper or take a photo (indicating which direction is north). A copy should be left with the community. Record the community’s analysis and responses in your project action tracker and follow up with the community later if/when you start action planning together. |
Facilitator’s Notes
- Mapping on the ground is easiest and allows for everyone can walk around it to see the map from different angles. This also allows a large crowd to view the map, contribute to it and easily make changes and corrections based on community discussions.
- Consider asking men and women to draw the maps separately. Different participants may draw different maps of the same area and that is ok. It reflects their different views of the community and of the topic discussed. As well, have the two separate maps will validate the results and highlight aspects that are important for men and women.
- Remember that you are not controlling the map. Give confidence to people by asking participants to draw the map and gradually take over the entire process themselves.
- Intervene only when it is necessary to involve people who are left out. Encourage those who are not participating.
- Maps can show how things looked in the past, how they look now and what people would like their community to look like in the future. Maps can also be drawn before and after an intervention to compare changes to available and accessible resources and services.
Next Steps
- Mapping in the rapport building stage might follow on with one of the following activities:
- T1c Animal Disease Mapping to identify major disease transmissions and outbreaks
- T4 Daily Activity Schedule to understand which activities take up the most time
- T5 Gender Roles and Responsibilities to understand men’s and women’s animal care-giving, management and use roles and responsibilities, and identify whether they desire changes in the division of labour
- T6 Seasonal Calendar to identify periods of scarcity and risk for the community
- T7 Historical Timeline to learn which major past events community members perceive to be significant to working animals and people
- The maps produced in the initiation phase might be referred to during a both mid-term (monitoring) and final evaluations during to illustrate changes and improvements to working animal resources and services.
- Discuss the map while doing a T22 Animal Welfare Transect Walk later on to see if it represented the ground reality.
Tool adapted from [79]
T1b: Mapping Animal Welfare Issues
This map shows a visual representation of the welfare status of animals within a community and the effects on people and animals. Using this tool will begin to focus both you and the community on the human and animal welfare issues that need further investigation.
| Tool purpose: | Time needed: |
| • To understand community participants’ perceptions about their main animal welfare issues and gauge their level of awareness about good/bad animal welfare states • To identify the status of animals’ welfare in households in the community and generate their motivation to improve their animals’ welfare | 2 hours |
| Materials needed: | |
| Materials needed: Chart paper, note cards, markers or other locally available resources, like sticks, stones, straw, beans, seeds, coloured powders or saw dust, etc. |
Keyword Search Tags
Project Phase:
Initiation Phase
Approaches for Working With Communities:
Community Development Approach, Community Engagement Approach
Behavioural Drivers (COM-B):
Behaviour Change Diagnosis and Planning, Motivation
Project Support:
Participatory Learning and Action Tools, Needs Assessment
Specific Topics:
Animal Husbandry and Management; Animal Welfare, Feelings and Needs
Animal welfare issues map
An animal welfare map (Figure T1b) shows the welfare status of animals in each household within the community, based on specific factors that the community find important. Maps will vary depending on how well the community understands animal welfare and perceives the welfare of its working animals at this early stage.
The map may contain a mixture of:
- Animal-based observations, such as weak and healthy animals, lame animals, animals with wounds or injuries.
- Owner-based observations related to the behaviour and management practices e.g. who overloads/beats their animal or who doesn’t keep their animal’s shelter clean.
- Resource availability and access, such as who has sufficient space or access to grazing land for keeping animals and who does not.
This map can be used to analyse the current animal welfare situation in the community and to identify the initial welfare problems that come to mind. Displaying and discussing the welfare status of each person’s animal is the first step in creating peer pressure for change. The map may also be used as a visual baseline that communities can use to compare against their future progress. When repeated after a period of time, changes in extent of animals with poor welfare status and availability of resources to care for them can be observed by comparing maps.
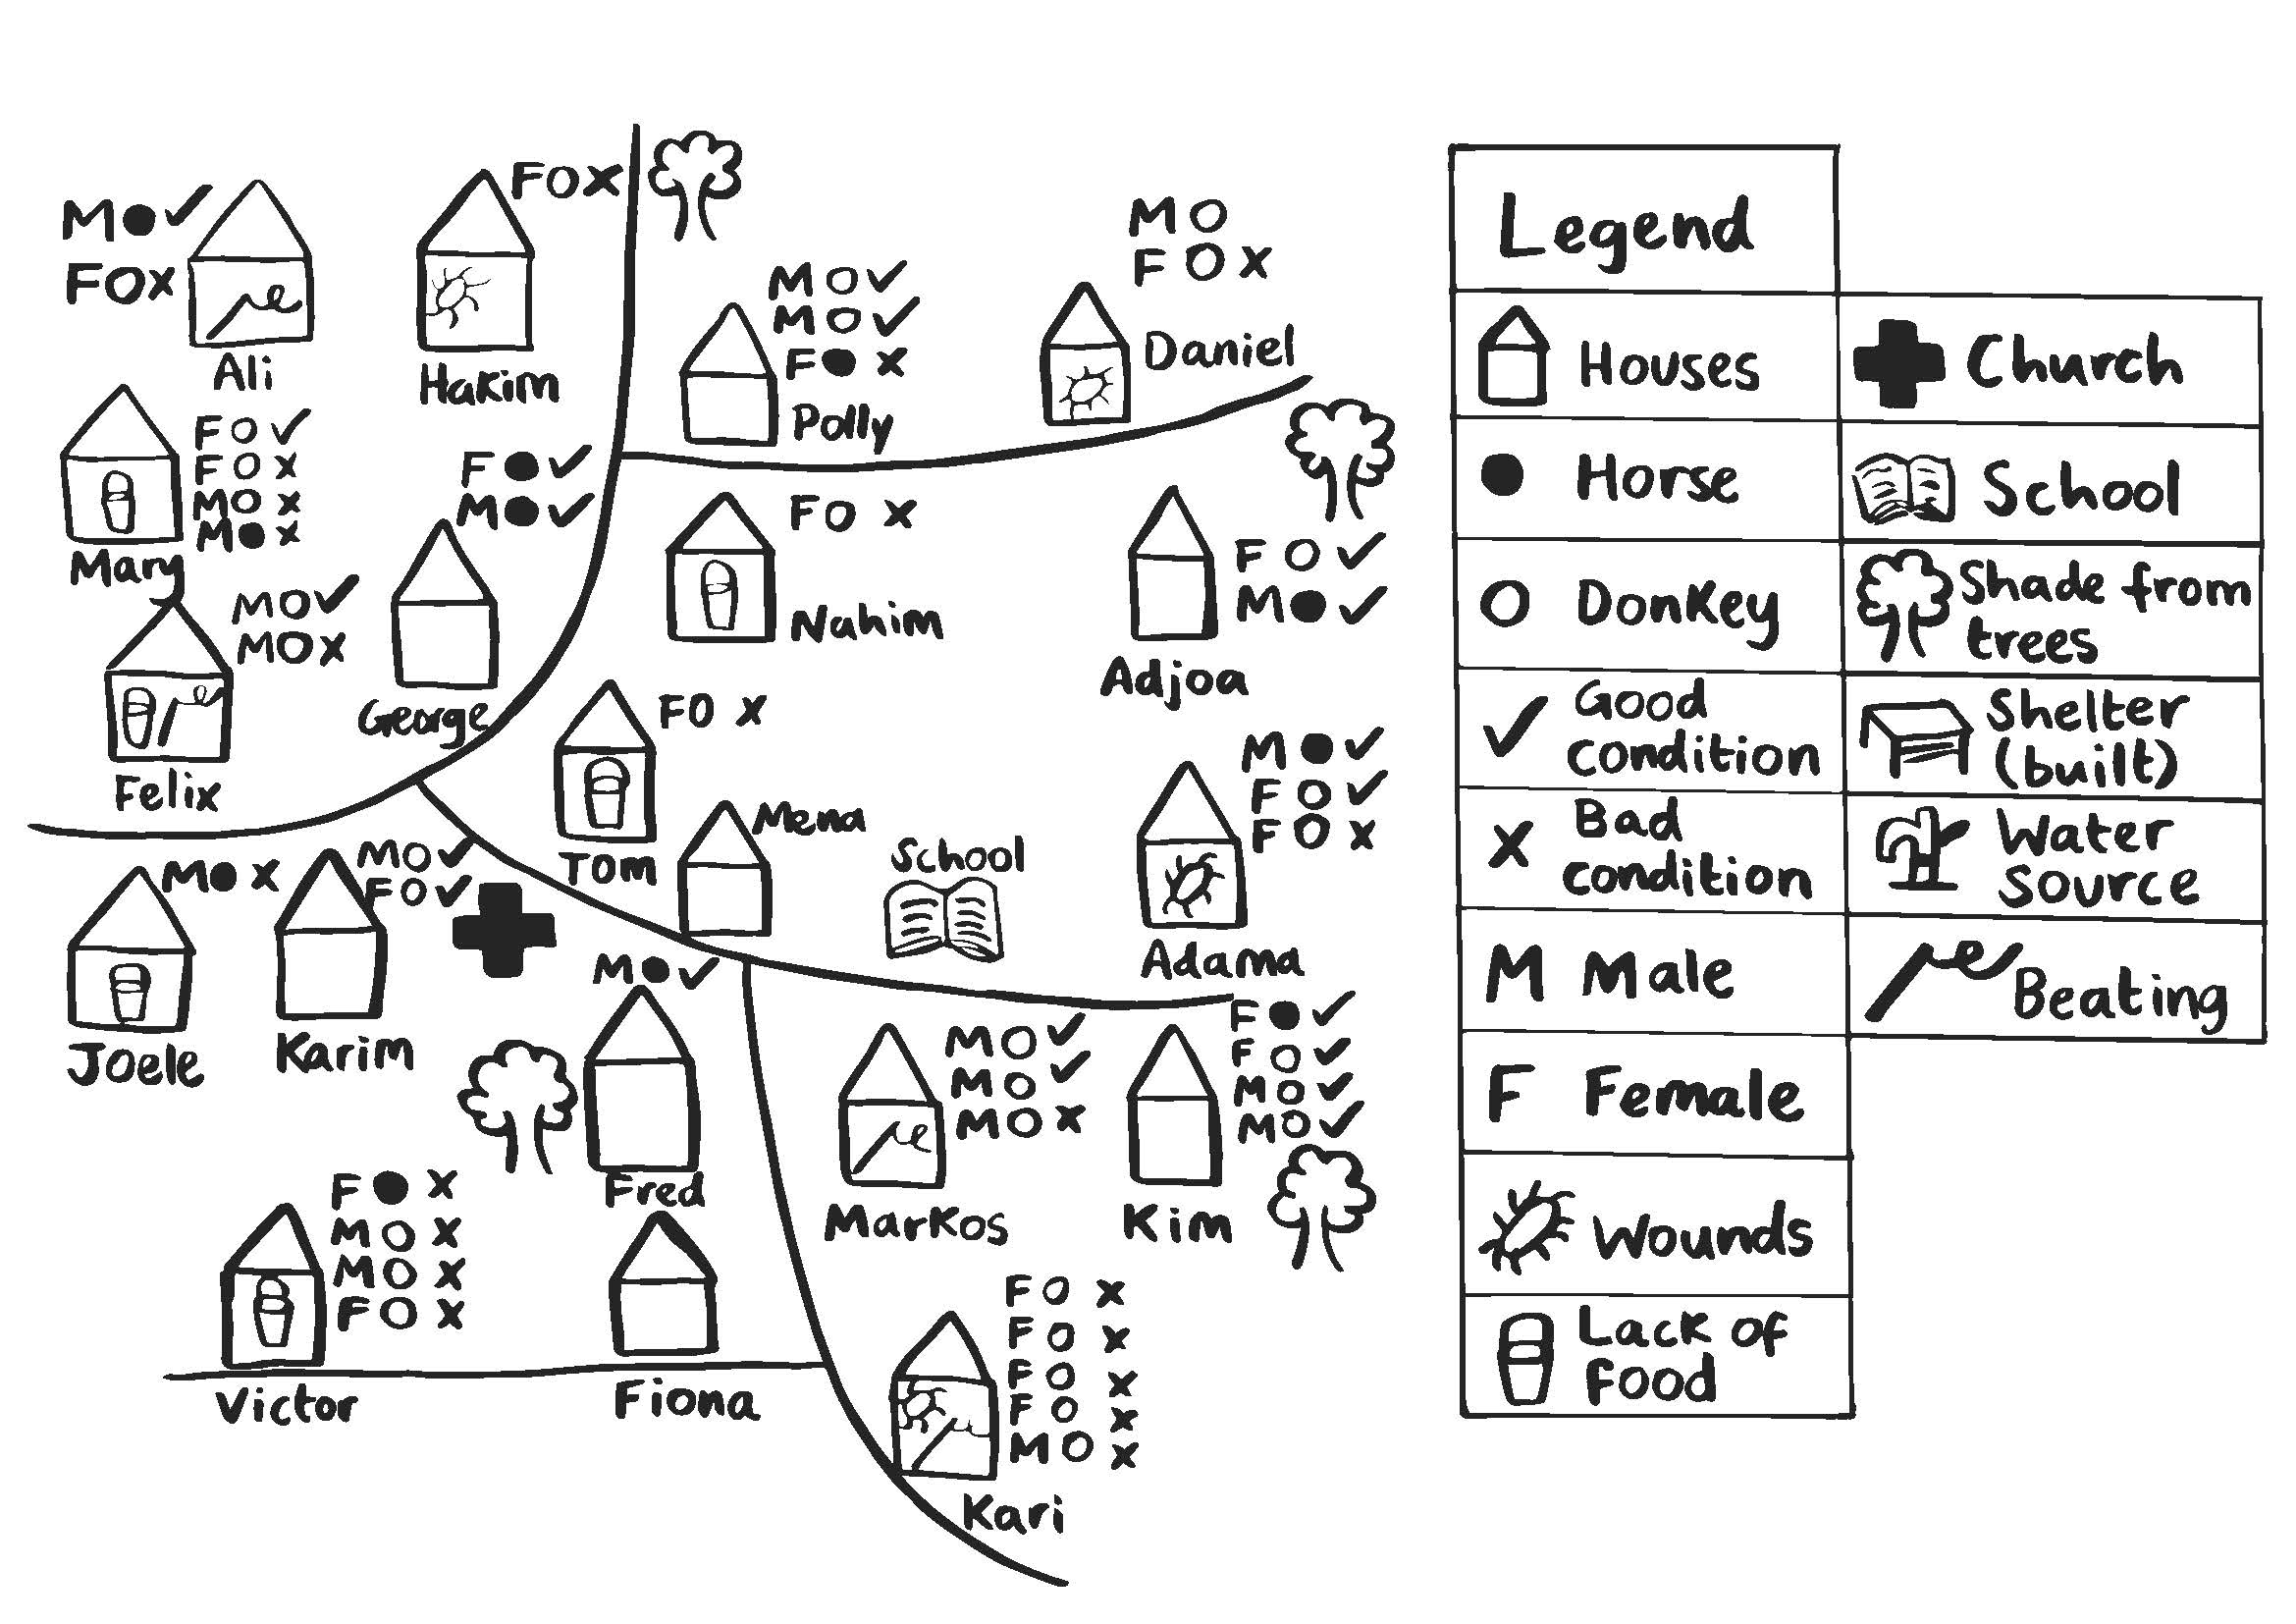
Figure T1B Animal welfare map from an equine-owning community
This map shows the welfare status of the animals in each household. Once the households with either a female (F) or male (M) horse (black dot) or donkey (white dot) were identified, the group identified animals in good (✓) or bad (x) condition. They then added some specific indicators of negative animal welfare: presence of wounds, malnutrition (lack of food) and beating (whip), and good animal welfare: available shade (trees) or shelter.
Based on the map, the group identified who they considered to be the best owners. They discussed reasons for the observed welfare status of animals, including why there were wounds on the animal and how they could be prevented.
| Animal Welfare Issues Map | |
|---|---|
| Step 1 | Start by explaining the purpose of the exercise and ask participants to draw an outline of their community on the ground or a large piece of chart paper using local materials, including: • General infrastructure, such as roads and paths, water points, community feed storage • Households in the community • Important, well-known places, such as clinic, school, temple/mosque, and meeting places |
| Step 2 | Ask participants to indicate households that have animals. Show the types and numbers of animals using symbols or local materials. Add details such as whether the animals are male or female (e.g. blue for males, red for females) and the kinds of work they do. |
| Step 3 | Ask participants to discuss and agree which animal is the best in the community. Mark it on the map using a symbol next to the house. (In figure 1B, ✓ = good, x = bad) Then ask if any other animals in the community are in a similarly good condition. Give these households the same symbol. Next, identify which animals are in a moderate condition, marking them on the map using a different symbol. Finally, show the animals which are in the worst condition. Please note: You may wish to start the discussion with the worst animal and move up to the animals in moderate and best condition. If households have more than one working animal, rank all animals within the household. |
| Step 4 | While participants are deciding which animals are in a moderate or poor state, ask them about how they are making their decisions. What criteria are they using in their discussions? These may include the behaviour of their owners in caring for their animals, the facilities or resources being provided to animals, and observations relating to the animals themselves, such as wounds, injuries, or body condition. |
| Step 5 | Using symbols, list the criteria participants used to categorize the welfare status of working animals and place symbols next to the animal or household. For example, if an animal is in poor condition due to beating, poor quality of feed and inadequate shade or shelter, put symbols for each of these next to the household. Ask participants if there is anything else that they would like to show on the map that they think is important to any aspect of their lives or livelihoods. |
| Step 6 | If the map was drawn on the ground, document it by either transferring it to a piece of paper or take a photo (indicating which direction is north). A copy should be left with the community. Record the community’s analysis and responses in your project action tracker and follow up with the community later if/when you start action planning together. |
Facilitation Notes
- Mapping on the ground is easiest and allows for everyone can walk around it to see the map from different angles. This also allows a large crowd to view the map and contribute to it.
- Consider asking men and women to draw the maps separately. Different participants may draw different maps of the same area and that is ok. It reflects their different views of the community and of the topic discussed. As well, have the two separate maps will validate the results and highlight aspects that are important for men and women.
- Remember that you are not controlling the map. Give confidence to people by asking participants to draw the map and gradually take over the entire process themselves.
- Intervene only when it is necessary to involve people who are left out. Encourage those who are not participating.
- Maps can show how things looked in the past, how they look now and what people would like their community to look like in the future. Maps can also be drawn before and after an intervention to compare changes to human and animal welfare, available and accessible resources and services and disease patterns.
Next Steps
- Mapping in the rapport building stage might follow on with one of the following activities:
- T4 Daily Activity Schedule to understand which activities take up the most time
- T5 Gender Roles and Responsibilities to understand men’s and women’s animal care-giving and use roles and responsibilities, and identify whether they desire changes in the division of labour
- T6 Seasonal Calendar to identify periods of scarcity and risk for the community
- T7 Historical Timeline to learn which major past events community members perceive to be significant to working animals and people
- The maps produced in the initiation phase might be referred back to during a both mid-term (monitoring) and final evaluations during to illustrate changes and improvements to working animal resources and services.
- Discuss the map while doing a T22 Animal Welfare Transect Walk later on to see if it represented the ground reality of the animal welfare situation
T1c: Mapping Animal Diseases
A disease map is a visual representation of disease patterns of animals within the community. Using this tool will begin to focus both you and the community on the human and animal welfare problems and issues related to disease that may need further investigation.
| Tool purpose: | Time needed: |
| • To identify major disease outbreaks for both animals and humans and possible linkages. • To understand disease route transmission and how outbreaks are handled. • To identify opportunities to prevent future outbreaks from spreading. | 2 hours per map |
| Materials needed: | |
| Materials needed: Chart paper, note cards, markers or other locally available resources, like sticks, stones, straw, beans, seeds, coloured powders or saw dust, etc. |
Keyword Search Tags
Project Phase:
Initiation Phase
Approaches for Working With Communities:
Community Development Approach, Community Engagement Approach
Behavioural Drivers (COM-B):
Behaviour Change Diagnosis and Planning
Project Support:
Participatory Learning and Action Tools, Needs Assessment
Specific Topics:
Animal Health and Services; Vulnerability and Resilience
Disease map (both humans & animals)
A disease map shows the animals and humans affected by disease. It may be used for both present and past disease problems in the village. This map may identify similarities between good and poor human and animal health and disease. Showing diseases on a map encourages analysis and further discussion of their symptoms, causes and routes or patterns of infection, as well as their effects on people, animals, owners and the community. The discussion can explore people’s concerns about their health, the health of their working animals and the things that they would like to change.
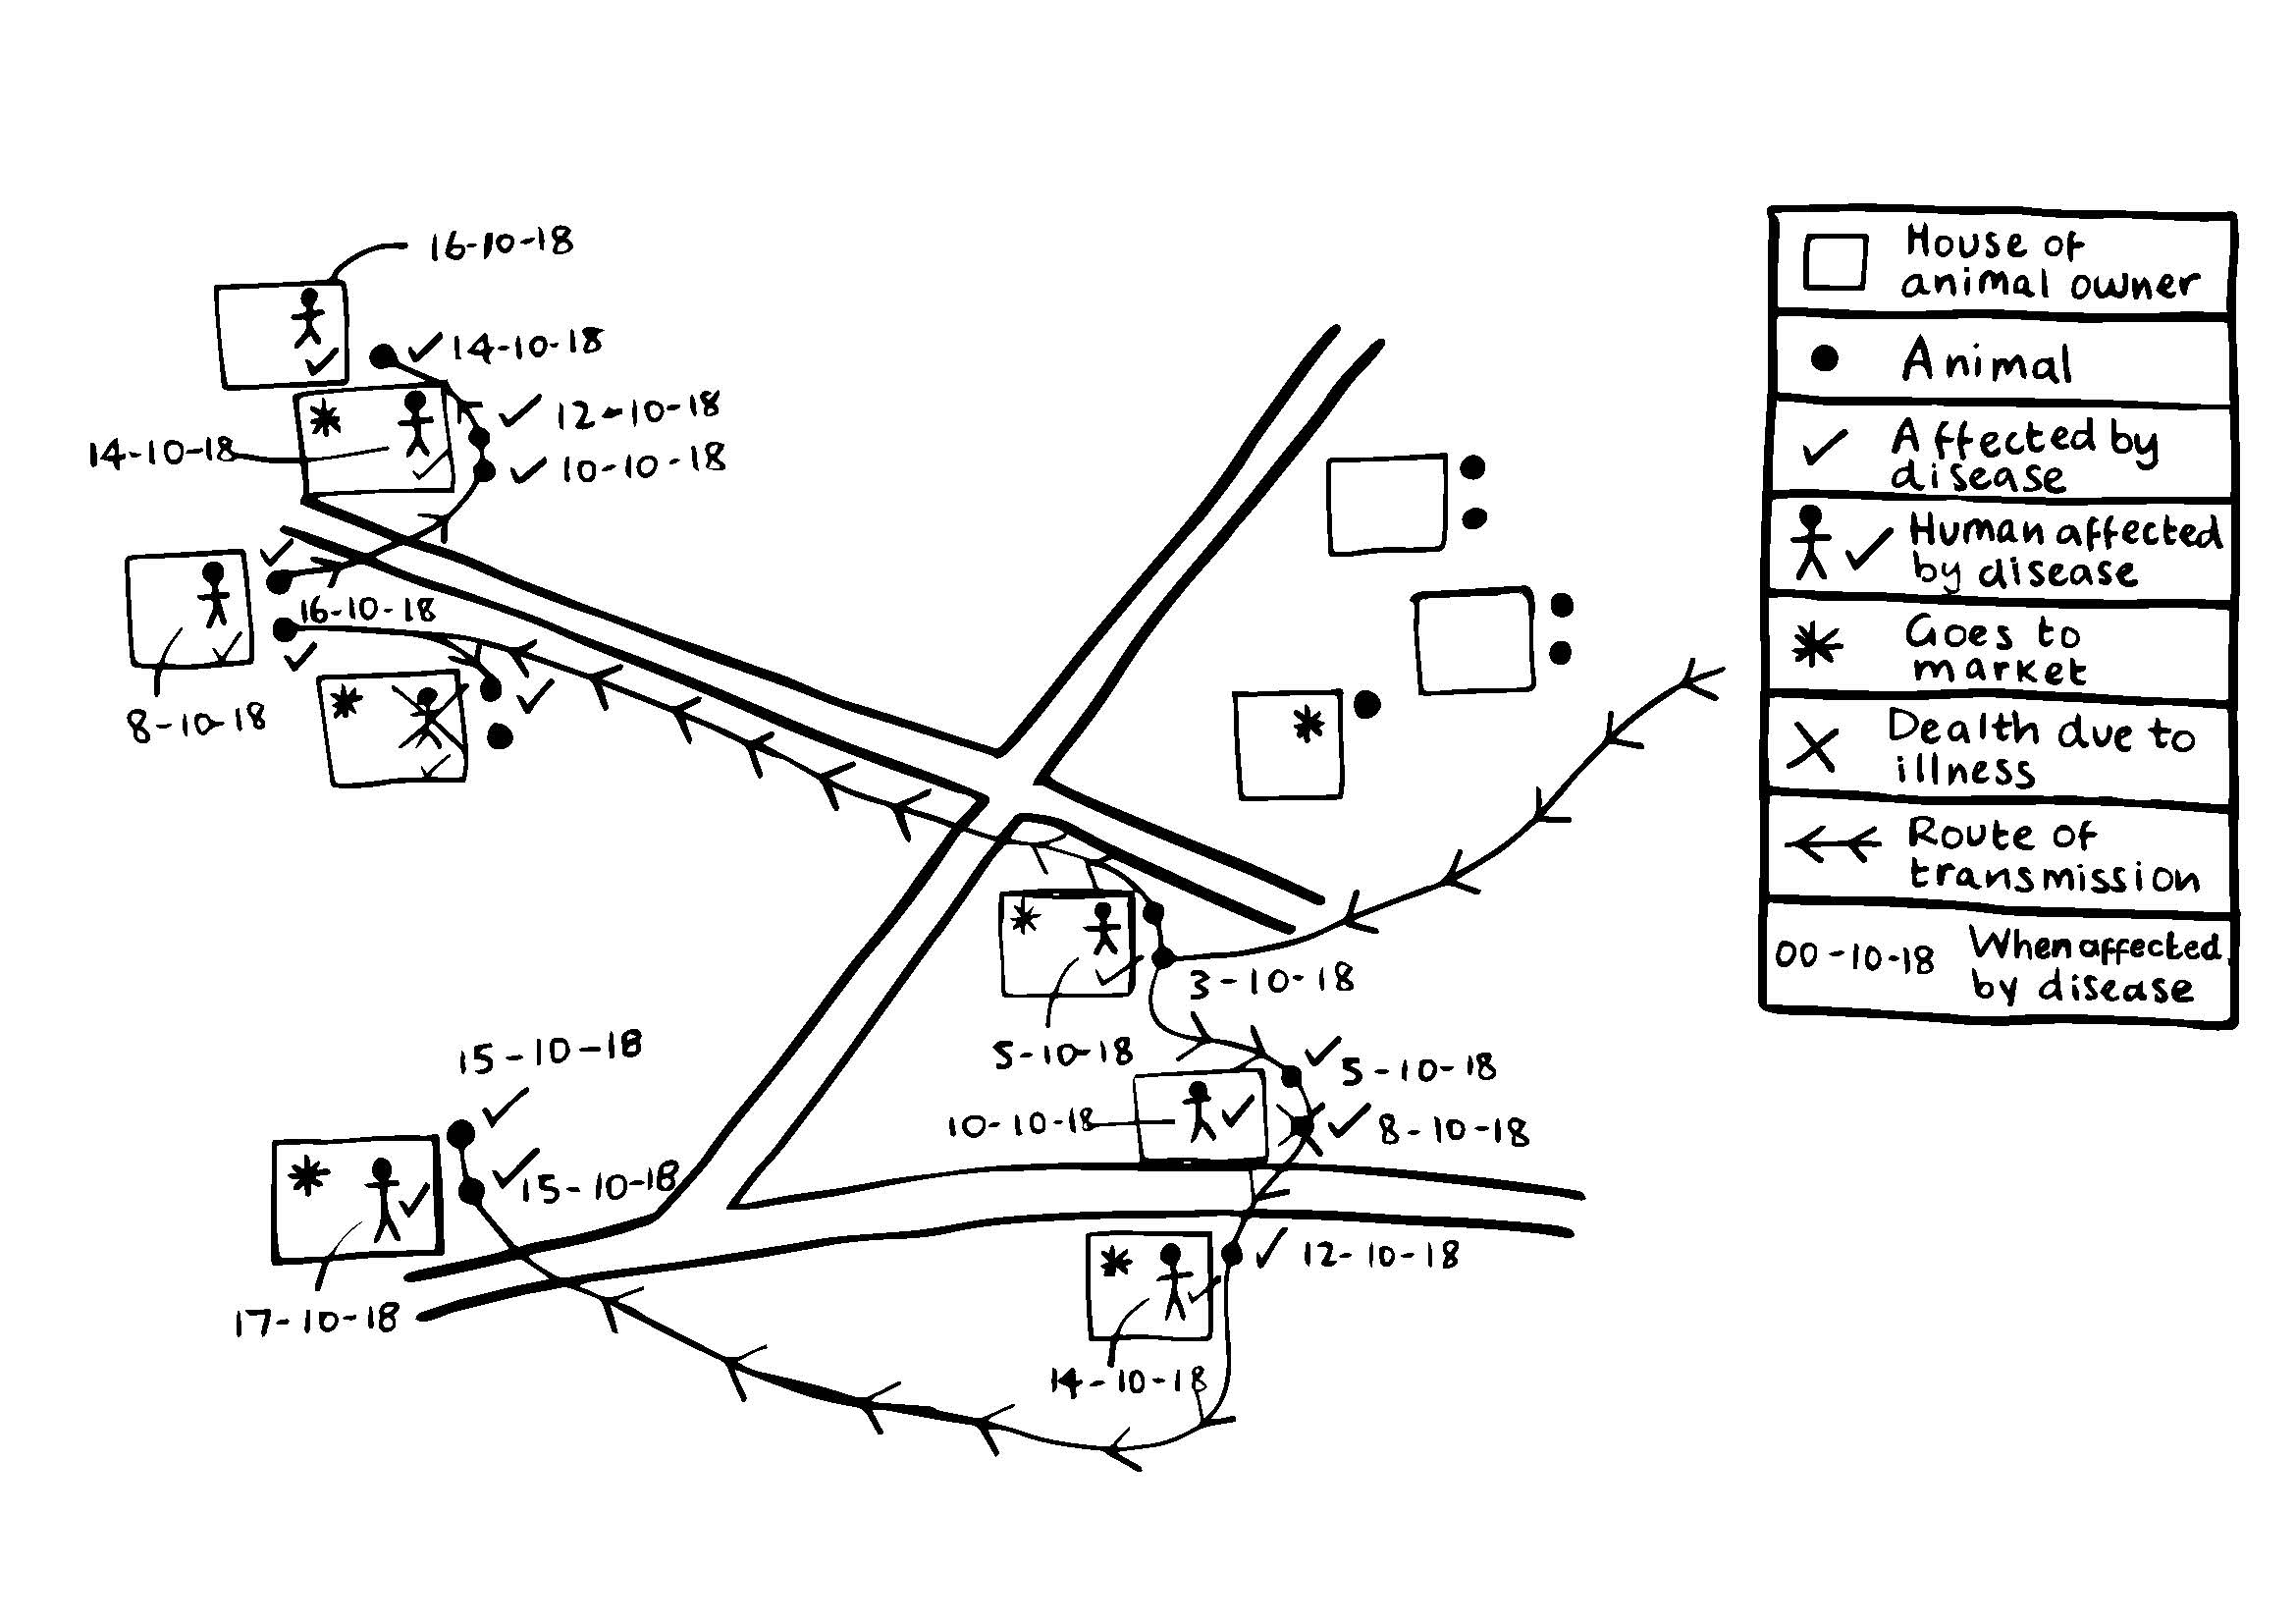
Figure T1C Animal disease map for influenza
The map above (figure T1C) was made by a community in a village where there was an epidemic of influenza. First the participants mapped their households and indicated where the animals were located. Then they showed which people and animals were affected by influenza and when, also indicating which people and animals had died. Using the dates of illness, the group mapped the source and route of transmission of influenza using arrows. Based on this, the owners developed an action plan for treatment of affected people and animals and prevention of further disease transmission.
| Disease Map | |
|---|---|
| Step 1 | Start by explaining the purpose of the exercise and ask participants to draw an outline of their community on the ground or a large piece of chart paper using local materials, including: • General infrastructure, such as roads and paths, water points, community feed storage • Households in the community, including details of each household’s family members • Important, well-known places, such as clinic, school, temple/mosque, and meeting places Please note: If T1A Resource & services map and/or T1B Animal welfare issues map were carried out previously, one of the maps produced during those activities may be used instead of creating a new one. |
| Step 2 | Ask participants to indicate households that have working animals. Show the types and numbers of animals using symbols or local materials. Add details such as whether the animals are male or female (e.g. blue for males, red for females) and the kinds of work they do. |
| Step 3 | Ask participants if there are any people or animals suffering from sickness or disease right now, at this moment. Encourage them to show all the sick people and animals on the map, using a different symbol for each disease. |
| Step 4 | Ask participants to show past cases of human and animal disease belonging to each household. Ask participants if there is anything else that they would like to show on the map which they think is important to any aspect of their life or livelihood. |
| Step 5 | Encourage the group to analyse and discuss what is shown on the map. Consider using the following guiding questions: • What are the reasons for the diseases? • When did the diseases occur (seasonal, or related to work patterns?) • How are the diseases recognized? • What are the possible sources of infection and/or contamination? • How are they spread? (If known) • Where do they go for treatment or who do they go to? • What are the implications of working animals’ disease on their livelihoods and wellbeing? • What are the implications of human health issues on their working animals’ welfare? |
| Step 6 | If the map was drawn on the ground, document it by either transferring it to a piece of paper or take a photo (indicating which direction is north). A copy should be left with the community. Record the community’s analysis and responses in your project action tracker and follow up with the community later if/when you start action planning together. |
Facilitator’s Notes
- Mapping on the ground is easiest and allows for everyone can walk around it to see the map from different angles. In this way, a large crowd to view the map and contribute to it.
- Consider asking men and women to draw the maps separately. Different participants may draw different maps of the same area and that is ok. It reflects their different views of the community and of the topic discussed. As well, have the two separate maps will validate the results and highlight aspects that are important for men and women.
- Remember that you are not controlling the map. Give confidence to people by asking participants to draw the map and gradually take over the entire process themselves.
- Intervene only when it is necessary to involve people who are left out. Encourage those who are not participating.
- Maps can show how things looked in the past, how they look now and what people would like their community to look like in the future. Maps can also be drawn before and after an intervention to compare changes to disease patterns.
Next steps
- Mapping in the rapport stage might follow on with one of the following activities
- T4 Daily Activity Schedule to understand which activities take up the most time
- T5 Gender Roles and Responsibilities to understand men’s and women’s animal care-giving and use roles and responsibilities, and identify whether they desire changes in the division of labour
- T6Seasonal Calendar to identify periods of scarcity and risk for the community
- T7 Historical Timeline to learn which major past events community members perceive to be significant to working animals and people
- The maps produced in the concept stage might be referred back to during a both mid-term (monitoring) and final evaluations during to illustrate changes and improvements to working animal resources and services.
- Discuss the map while doing a T22 Animal Welfare Transect Walk later on to see if it represented the ground reality.