QUICK LINKS
T6 Seasonal calendar resources and services
Seasonal calendar of the lives of animals, their owners, users and carers
T6 Facilitator's NOTES
T6 NEXT STEPS
T6: Seasonal Calendar Resources and Services
A seasonal calendar is used to plot changes over the annual cycle. This tool provides a visual representation of seasonally varying phenomenon, such as production activities, illness and disease, migration patterns and much more [48]. This is a useful exercise to carry out with a community as part of a needs assessment and shared vision, which identifies mitigating action. This tool enables people to analyse changes across seasons in the lives of animals as well as their owners, users and/or carers, as well as how these changes may be linked to each other.
| Tool purpose: | Time needed: |
• To identify periods of availability and scarcity (water, food, income) to target programme activities
• To identify periods of lowest and highest risk (disease, poor health, poor body condition) to target programme activities
• To identify potential linkages or causal factors related to the livelihoods of animals’ owners, users and carers | 1.5 - 2 hours |
| Materials needed: |
| Chart paper and markers or sticks, stones, straw, leaves, beans, seeds, pulses, coloured sand or chalk powder and/or any other locally available materials to represent each aspect in the chart |
Project Phase:
Initiation Phase
Approaches for Working With Communities:
Community Development Approach, Community Engagement Approach
Behavioural Drivers (COM-B):
Opportunity
Project Support:
Participatory Learning and Action Tools, Needs Assessment
Specific Topics:
Animal Health and Services; Livelihoods; Vulnerability/Resilience, Animal Welfare, Feelings, and Needs
Seasonal calendar of the lives of animals, their owners, users and carers
The seasonal calendar can include many aspects of life. For example, it may highlight changes in animal welfare according to seasonal variations in workloads or availability of feed, which may also be associated with changes in household income and/or expenditure. It can help the community to decide actions to improve animal welfare and plan ahead to prevent welfare from getting worse in difficult seasons, as well plan alternative livelihood strategies for times when their working animals will not be required, required less or for different purposes. Each important aspect is identified and defined by the community.
Different criteria is agreed by the community to illustrate seasonal variations in:
- festivals, religious ceremonies, important local events
- household income
- household expenditures
- consumption of animal feed and fodder, grazing or other resources
- seasonal prevalence or incidence of animal diseases
- general health status of people in animal-owning households
- the general body condition or welfare status of animals
- availability of water and/or other important natural resources
- availability of work or employment and other livelihood related activities
- work load of animals and humans e.g. periods of heavy work or periods of relative ease
- migration patterns of animal-owning families
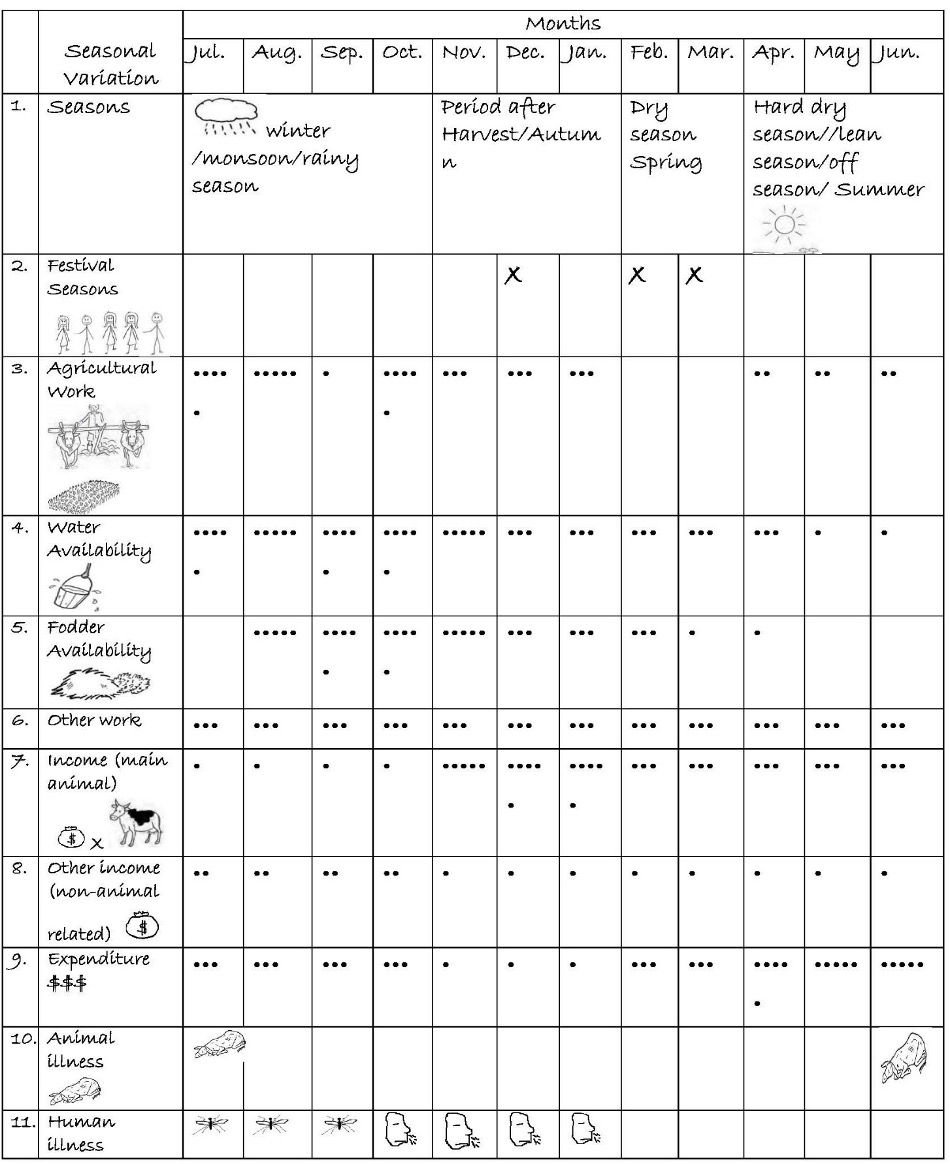
Figure T6 Seasonal calendar created by a group of animal owners in Thies, Senegal
The example above was conducted with a community, whose livelihoods depend on animals, especially during periods of agricultural harvest. Men and women primarily rely on animals to support their livelihoods, but have additional sources of income throughout the year. From this calendar, we come to understand:
- There are four seasons: Winter/Rainy or Monsoon season, Autumn/Harvest time, Spring/Dry Season, and Summer/Lean Season (1st row)
- Two major festivals take place (2nd row) in December and January/February
- Water (4th row), harvesting (3rd row) and fodder availability (5th row) are extremely low or non-existent during the dry season (Aug-Sept) and highest during the rainy season (Oct-Dec).
- Animal-related (7th row) and non-animal related (8th row) income varies between men and women, with women bringing in more non-animal-related income (8th row) throughout the year and men bringing in more animal-related income (7th row) generally.
- Both income (7th & 8th rows) and household expenditure (9th row) go up during festival months.
- There appears to be a relationship between animal body condition (10th row), availability of feed/fodder (5th row) and disease prevalence in animals (9th row):
- Animal body condition is worse and disease prevalence (9th row) higher during summer season (Jun - July), when there is low water availability, no fodder.
- Human health is also worse during the winter months (July-Sept). The issue of diseases (11th row), discussions focused on the most disease prone periods. For more details, during this exercise the communities indicated that from July to January, there is usually an outbreak of seasonal diseases like Malaria, during the rainy season (July-August-September), and; seasonal flu from October to January. Communities indicated that the fatigue accumulated during the harvesting season (3rd row) and water availability (4th row) are some of the aggravating factors.
- As far as expenses (9th row) are concerned, there are fewer expenses related to household care just after the harvests. In fact, during this period consumption is mainly derived from the harvest, and expenditure concerns other aspects such as education and health. Sometime afterwards, expenditure increases due to the reduction in food stocks and the need to prepare for the next season (seeds, inputs, etc.). Taking care of the animals during this period also requires expenditure due to the scarcity of grasses.
| Seasonal Calendar of the Lives of Animals and Communities |
|---|
| Step 1 | a) Start a discussion by asking participants about the local calendar and seasonal landmarks, for example dry or rainy seasons, before or after festival periods or religious ceremonies.
b) Ask the helper to draw a matrix on the ground or large piece of chart paper and list the identified seasons on the horizontal (top) axis including the months in which they fall.
c) On the first line of the vertical axis, add the identified seasonal landmarks (1a). Instead of words, the group may identify unique characteristics of each season and depict these using a symbol or drawing. |
| Step 2 | a) Move on to a discussion about the present season and their main work during this season. Add the work to the vertical axis. Then ask about:
b) Other work during the year
c) Income generated from the main work
d) Income generated from the other work
e) general house expenditures throughout the year
f) Big issues related to animals and humans, such as:
• Animal illness/disease
• Human illness/disease
• Availability of water/feed/fodder, etc. |
| Step 3 | Decide with the group how they will display the situation. Encourage participants depict seasonal changes using locally available materials. You may also use symbols or simply write words on cards.
For example:
• Higher income levels can be shown by placing a lot of seeds/money on the month in which this occurs, while a decrease in income the next month is shown with just a few seeds.
- Figure T6 used dots, or you can use dollar signs ($) for income, whereby five dots or $$$$$ = high income and a single dot or $ = low income (Rows 7, 8, 9)
• On the same note, you can use the dots to represent abundance or scarcity. Abundance can be represented by 5 dots whereas a single 1 dot represents scarcity; and those in between can show relative references to abundance or scarcity.
- Figure T6 used 5 dots for periods of high-water availability, 3 dots for average water availability and 1 dot for periods of water scarcity (Row 4).
• You can also use by shading Dark colours to represent periods of abundance and light colours periods of scarcity. |
| Step 4 | Explore the relationships between different seasonal events, activities and problems for animals and humans, especially those that show changes at the same time. The availability of resources either in the form of fodder or water availability or income or spending shows you what kind of physical opportunities are available to create an enabling environment for people to change their behaviour towards their animal’s welfare.
Also discuss any similarities between the well-being of animals and humans throughout the seasons. Once the calendar is complete, discuss the results of the activity with the group. |
| Step 5 | Record the community’s analysis and responses in your project action tracker. Leave the seasonal calendar with the community and take a copy/picture for your records. Follow up with the community later when you start action planning together. |
Facilitation Notes
- In exceptional cases, where there are more than 20 people in the group, consider dividing participants into smaller groups to compare the seasonal changes amongst different groups of people. Encourage people to arrange themselves into the smaller groups with those they feel share greatest similarities (e.g. men / women, owners / users).
- It may be helpful to have more than one facilitator to support/facilitate small group work and discussions, especially if there are many participants.
- Before starting this exercise, discuss the calendar focus areas (which specific aspects will be examined) and how it will be used to analyse how the welfare of working animals and their related livelihoods and well-being change in different seasons. Also, how certain changes may be linked or cause challenges in their capacity to care for their animals.
- Be clear that the aim of the activity is to discuss how seasonality affects animal welfare and people’s livelihoods and identify challenging seasons. In this way, participants’ expectations can best be managed, and potential frustrations or perceptions that facilitators are more interested in animals’ well-being than people, can be mitigated. This is particularly important given that some changes in livelihoods and well-being may be identified, but it may be beyond the capacity of the project to address them.
- New facilitators might look into historical weather and food security reports (FEWS NET) to gain an understanding of seasonal challenges that the community might be facing before meeting with the group, which will help with identifying dry/lean, rainy/fruitful seasons and historical water shortages.
Next Steps
Seasonal calendars during the rapport building stage might accompany or be created alongside one or more of the following tools:
- T3 Venn Diagram (T3a Resources and Services Venn Diagram) to understand identify animal-related resource and service providers animal-owning communities rely on most and their level of satisfaction with each one
- T4 Daily Activity Schedule to understand how people and animals in animal-owning communities spend their time
- T5 Gender Roles and Responsibilities to understand men’s and women’s roles in caregiving, and using and caring for animals
- T7 Historical Timeline to learn which major past events community members perceive to be significant to working animals and people.
Link to References Cited
QUICK LINKS
T2 Mobility Map Resources and Services
T2 Location of Services and Resources
T2 Facilitator's NOTES
T2 NEXT STEPS
T7: Historical Timeline Resources and Services
The historical timeline is an excellent tool to start building rapport with a community. This activity can provide both the facilitator and participants with insight into how participants perceive their past and which events they perceive as most important. It generates discussions and understanding of how past events have contributed to shaping, either positively or negatively, conditions in the present. This tool has been adapted to the context of animal welfare [50], and can be used to create a timeline of animals’ history in the community, including events such as their introduction to the community, changes in the way they are used, disease outbreaks, and external factors or events that affect their lives and the community members who depend on them. This tool works well when carried out with community elders.
The value of this exercise lies in the discussions that take place during the process of developing the timeline, rather than recalling or remembering every event. Discussions can highlight important issues in the lives of animals and their owners, help identify critical drivers of change and root causes of the current situation. Discussions can uncover patterns of reoccurring events and their perceived impacts. Finally, the historical timeline can act as a retrospective learning activity to bring participants’ attention to significant events, occurrences or changes that happened, and promote awareness and commitment to sustained change.
| Tool purpose: | Time needed: |
• Generate understanding of major past events community members perceive to be significant to the lives of animals and people.
• To understand changes over time regarding working animals, their use, the livelihoods of community members who depend on them, and/or recurrent shocks or trends which influence the vulnerability of communities and their animal
• Can identify key policy focus areas, or key government stakeholders or potential project partners helpful to addressing issues of shared interest. | 2-3 hours |
| Materials needed: |
| Cards, pens/markers |
Project Phase:
Initiation Phase
Approaches for Working With Communities:
Community Development Approach
Project Support:
Participatory Learning and Action Tools, Needs Assessment, Gender Analysis
Specific Topics: Animal Husbandry and Management; Livelihoods, Vulnerability/Resilience
Historical Timeline
The historical timeline (figure T7) begins in 1950 when the first Community Leader was elected. The first animal (ox) was purchased by Omar in 1969 and the second animals (donkeys) were purchased by Asim in 1980. This exercise was done as part of the initial interaction with the community during the rapport building phase and generated an interesting discussion on animal ownership and use in the village.
| Historical Timeline |
|---|
| Step 1 | Draw a line on the ground and show that one end represents the beginning point in lifetime of the eldest participant and the other end represents the present. Ask what is current and what is past, letting participants define the past.
Begin the discussion by asking participants to identify significant events in their community and write them on cards. They should identify whatever they feel is significant without any constraints at this stage. |
| Step 2 | Ask participants to identify which of the significant events are important to their lives and the lives of their animals. Which events that have shaped the lives of working animals, their use of them, or the related benefits they obtain from them?
Have participants organise all identified events in chronological order. Start with the earliest event at the top, gradually adding all later events until they reach the present at the end line.
Please note: Recalling specific dates and times can be challenging. It is more important to have the events in chronological order. Encourage participants to think about the events in relation to each other or in relation to other well-known local or national events. This will enable them to work out the sequencing of events along the timeline, without wasting time agreeing on precise dates.
Then identify significant milestones or events to add to timeline (both positive and negative) related to the history of working animals in their community.
Consider using the following to guide the discussions:
• When were the first working animals introduced?
• Environmental catastrophes e.g. earthquake, hurricane, tsunami, and/or floods
• Introduction or occurrence of disease epidemics/outbreaks, human or animal (e.g. cholera)
• Availability of services and/or resources within the community e.g. water point construction, health centre construction, animal health service providers
• Introduction of new technologies e.g. animal traction, animal cart/harness design, mechanized transport, or machinery (e.g. tractors, ploughs)
• Introduction of new practices e.g. building household or communal animal shelters, soil or water conservation practices, improved farming practices, food/feed storage
• Introduction of new income generating activities e.g. construction jobs, renting animals, selling goods/services, sale of home-grown food production
• Major seasonal changes (e.g. longer dry/rainy season)
• Hard times when animal owners had to sell animals or other assets to survive
• Periods of political change, major conflicts, civil unrest, war
Consider asking:
• Which actors or stakeholders were involved in the major developments or events?
• Are there any other key milestones or turning points which, you feel shaped these events, either positively or negatively?
Place added events within the timeline in relation to the first event (or beginning of the timeline). Give participants time to respond individually. |
| Step 3 | Once all events have been identified, ask participants to confirm that everything has been captured. Make necessary adjustments until participants are satisfied that the timeline represents the perceived history of their lives and lives of their animals. |
| Step 4 | Discuss events that participants are interested in and inquire about events that you are particularly interested in better understanding.
If this activity was conducted separately with men and women, rather than collectively, bring the groups back together to compare the two timelines as appropriate to local context.
Use the following questions to help guide the discussion:
• Did any of these events lead to or cause another?
• Which of these events were major obstacles or opportunities to improving the lives of working animals and people who depend on them?
• How were the obstacles overcome?
• Are any obstacles, issues, or challenges recurring?
• Are there any other noticeable recurrent patterns of events?
If comparing the timelines between two groups (e.g. men and women), ask participants whether there any similarities and differences in events on each timeline or perceived significance of events similarities? If yes, why? You may do this together if contextually appropriate. If done collectively between men and women, you might ask which events are most significant for men and women.
Alternatively, you can compare the two results yourself and follow up with men and women participants independent of the group scenario to gain a deeper understanding of significant differences. |
| Step 5 | As a final step, ask participants what activities and events, if any, are planned to enhance their lives or the lives of their animals? |
| Step 6 | Once the timeline is complete, take a photo or record of the chart on a piece of paper, ensuring the community has a copy for their records. A copy is retained by the facilitator for future reference or planning. Add any notes or interesting points to your project action tracker. |
Facilitation Notes
- Aim to include a broad cross-section of animal-owning household members from the community, across multiple generations.
- If it is not possible or locally appropriate to do the exercise collectively with both sexes, consider conducting the exercise separately with men and women. Each may recall different events due to the impacts these events had on their lives.
- If possible, invite 10-20 people to participant in this exercise.
- Do not lead participants into identifying events that are not important to them. While asking probing questions, emphasize including only events that they perceive to be important. Events should not be included simply because you inquired about them.
- Encourage participants not to spend too much time engaged in a discussion about the exact date of events, or precisely defining timeline intervals. Make it clear that discussion on the order of events is more important.
- The timeline tool can be challenging to facilitate. Maintain the focus and get broad participation. Carefully manage controversy and mitigate arguments should they arise.
- Participants may find it difficult to relay events in a chronological order. People often use a local time frame that may be different from a traditional calendar year. Use your judgement to enable them to articulate time in a way in which you can both relate.
- Disagreements may arise through discussions on controversial past events. Try to:
- Mitigate potential disagreements and blame by keeping participants focused on facts; who did what and when they occurred.
- Not to force a conclusion, as there may be different interpretations.
- Have participants add their differing interpretations to the timeline.
- Ask participants to explain the event from their perspective.
- Include multiple timelines to reflect differing views of a single event/actor. Views can be further reflected on in subsequent discussions at the end of the exercise.
Next Steps
In order to better understand the lives and context of the animal owning community during the initiation phase, consider using the following tools in addition to the historical timeline:
- T1 Mapping to understand the community’s perceived welfare issues.
- T11 Change Analysis (T11a Changing Trend Analysis) to know how change happened from past to present
- T4 Daily Activity Schedule to know when best to meet with men and women or children; to understand differing roles.
- T6 Seasonal Calendar to identify periods of scarcity, highest risk and when animal body condition and/or resources supporting animal health and welfare are the best/worst.
Link to References Cited
QUICK LINKS
T11a Changing trend analysis
t11b Before and Now Analysis Changing Trend
This PLA may be conducted to assess change in a variety of contexts, and this tool includes guidance for two different versions, including: a) changing trends analysis, and b) before and now change analysis.
T11a: Changing Trend Analysis
A changing trend analysis helps the community to identify changing trends over time, for example over generations. Here, a ‘generation’ refers to people born and living around the same time e.g. ‘grandparents generation’, ‘parents generation’, ‘present generation’ etc. Through discussion of present and past situations, this tool enables participants to identify the significant changes that have occurred over time, promoting a greater understanding of the current situation.
| Tool purpose: | Time needed: |
• To reflect on changes to the lives of animals and animal-owning households within a community over time:
- animal populations
- reliance and use of animals
- animal husbandry and management practices
- disease patterns
- availability and use of health services and resources
- climate or other environmental factors
• To generate discussion about significant changes over time and reasons for any perceived negative changes that have occurred | 2 - 3 hours |
| Materials needed: |
| Cards, pens, markers, coloured powder, chalk, sticks, tree leaves, coloured cards or other locally available materials. |
Project Phase:
Initiation Phase
Approaches for Working With Communities:
Community Development Approach, Community Engagement Approach
Behavioural Drivers (COM-B):
Capability, Motivation
Project Support:
Participatory Learning and Action Tools
Specific Topics:
Animal Husbandry and Management; Animal Welfare, Feelings and Needs; Animal Health and Services; Livelihoods; Vulnerability / Resilience
Changing trend analysis
Figure T11A-1 Changing trend analysis matrix (analysis criteria on vertical axis, generations on horizontal axis)
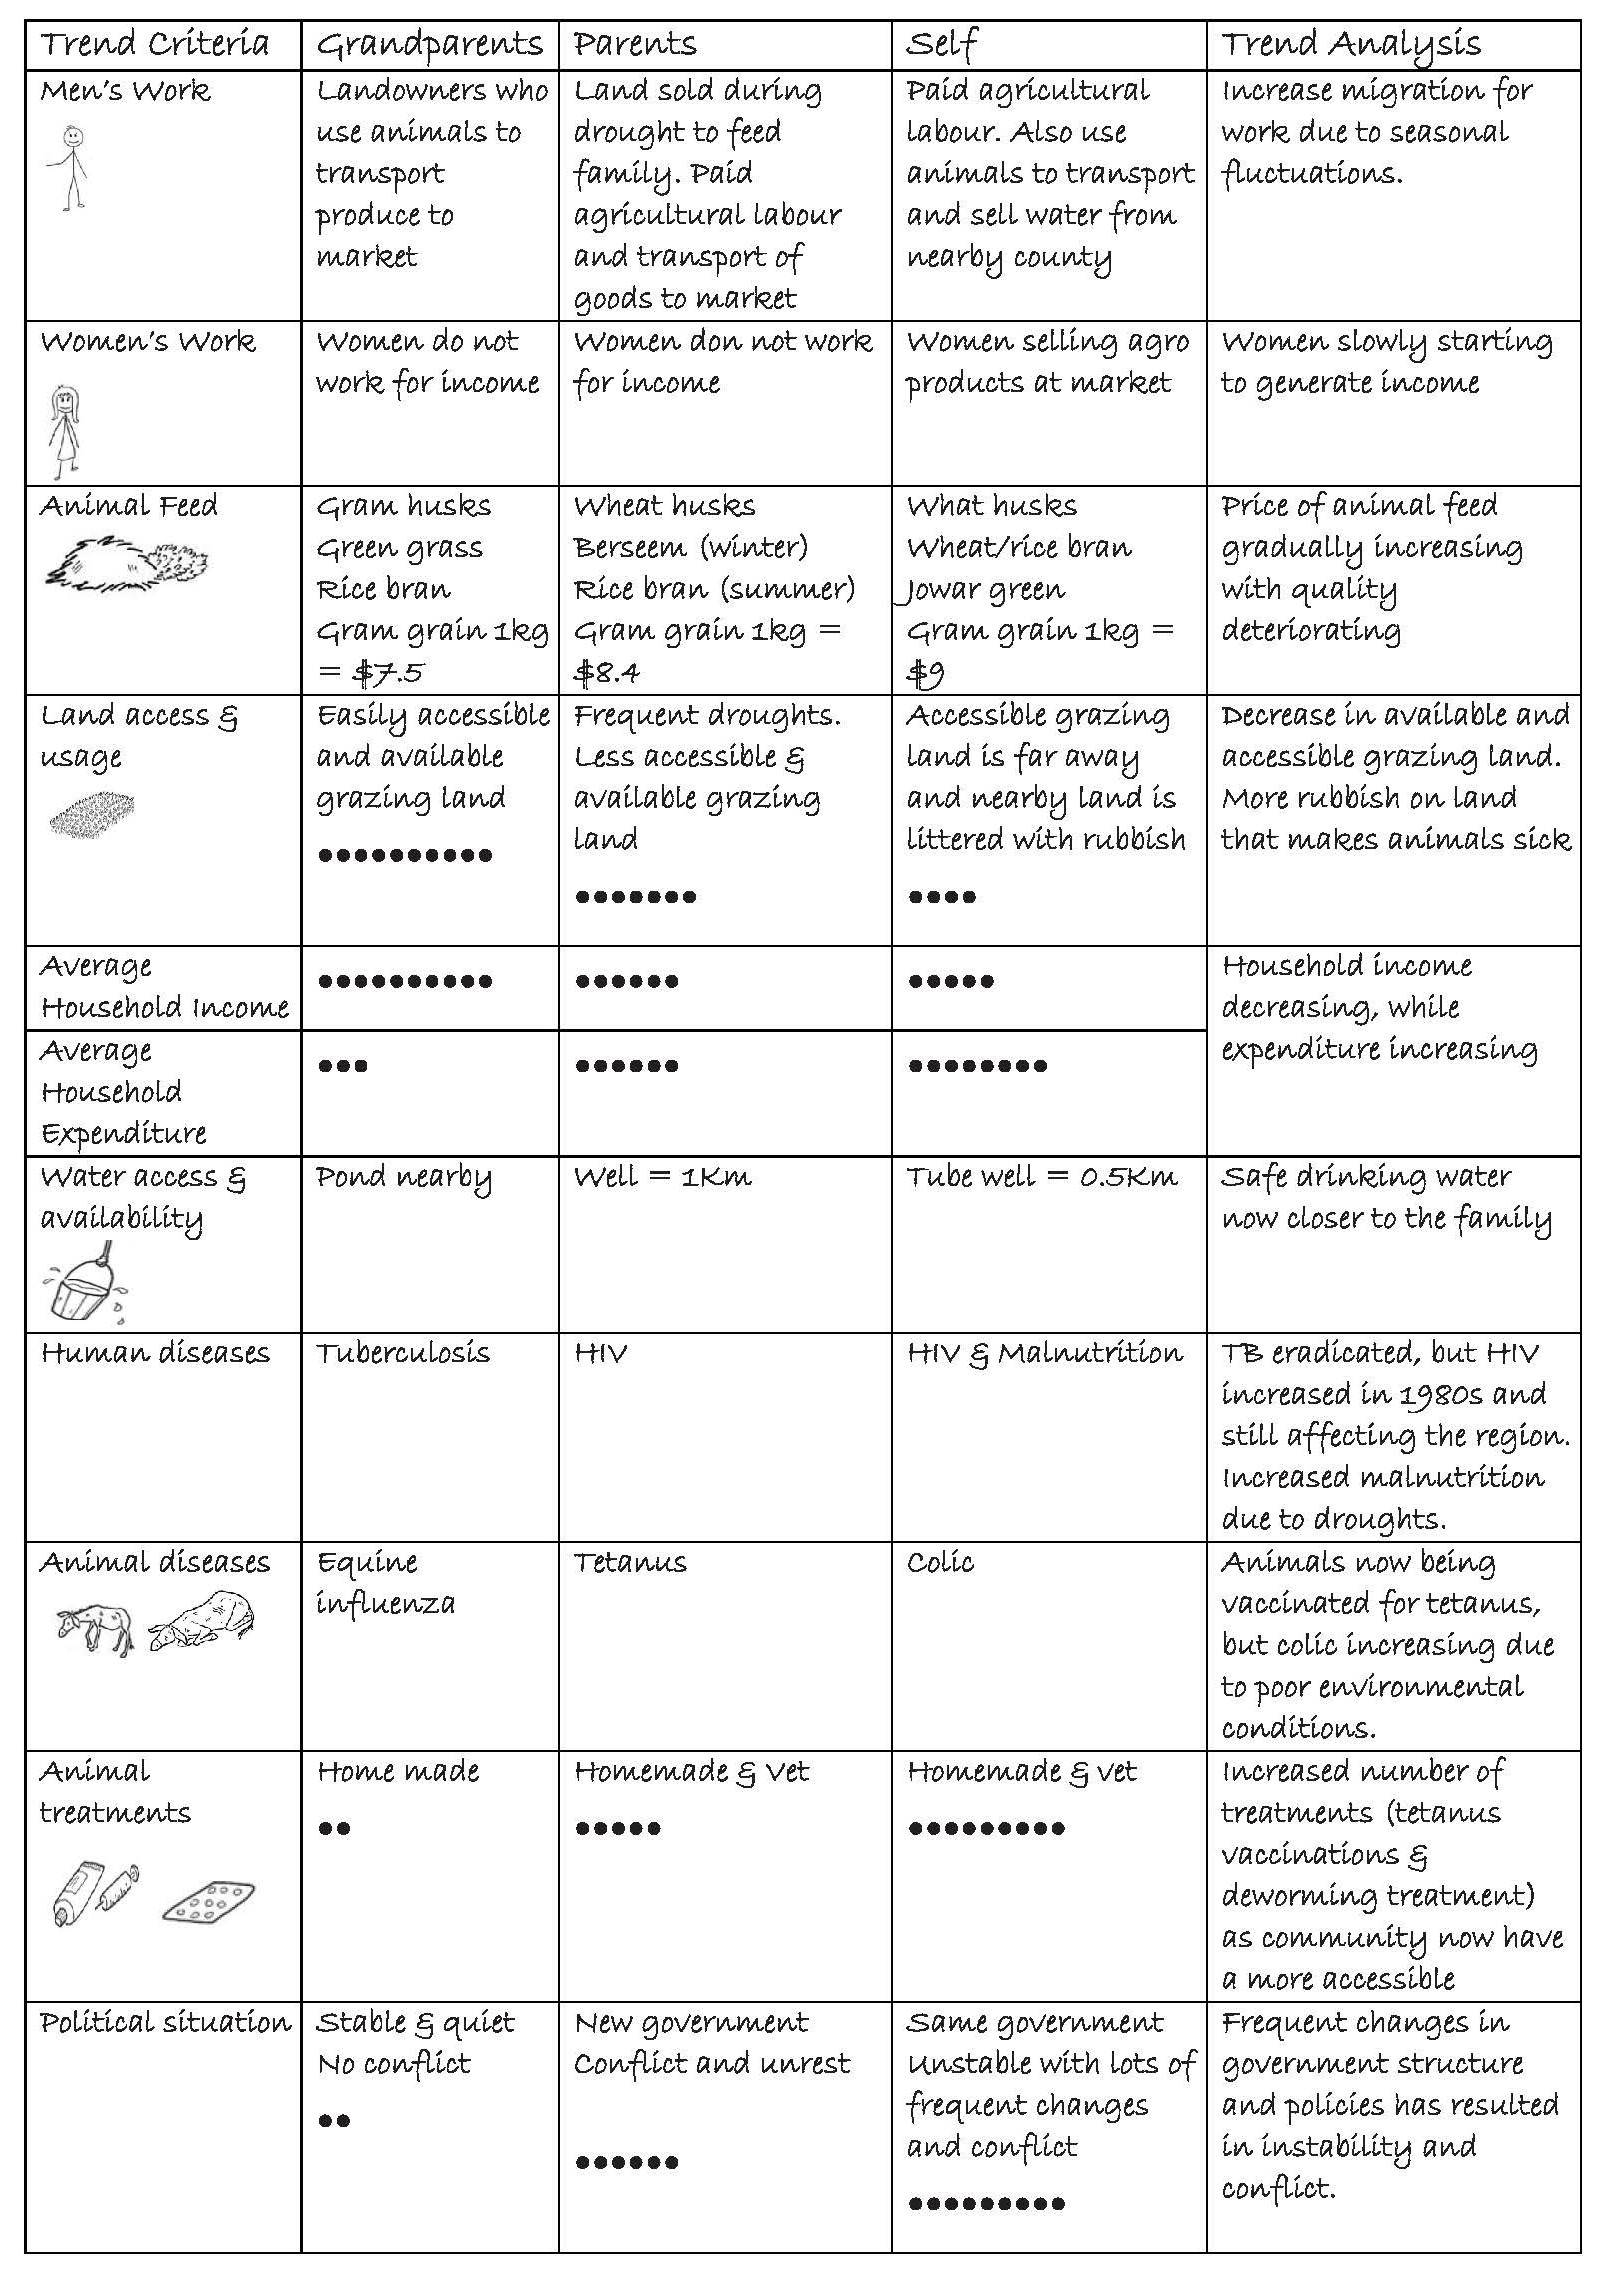
Figure T11A-2 Changing trend analysis of changes affecting potters and their working animals over four generations
The completed matrix above is the result of a changing trend analysis carried out with a group of animal-owning farmers. It was used as part of a community needs assessment and shared vision. It shows changes in work type and land ownership, quantity, type and cost of animal feed and fodder, grazing land accessibility and availability, average household income and expenditure, availability of and distance to travel for water, human and animal disease prevalence and treatment options, and changing political situation. As a result of this exercise, farmers were able to identify opportunities to mitigate the trends they identified as negatively impacting their lives and the related welfare of their animals.
| Changing Trend Analysis |
|---|
| Step 1 | Start by explaining that the purpose of the exercise is to understand how the situation in the community has changed over time, and that the group will start with the present and then look at the past. Then ask the group what changes they have experienced in their lives as compared to the past?
Examples:
• Income-generating activities for men and women (separately)
• Household income
• Household expenditure
Other human aspects, such as food consumption, health and illness, education, and social groups, such as religious groups, self-help & savings/loaning groups, women’s groups. Access & availability of natural resources, such as water, wood, soil, land, etc.
Then ask about changes they have experienced related to their animals.
Examples include:
• Types of animals
• Animal work types
• Feed practices
• Health/illness
• Treatment
Ask the community helper to write all identified changes on cards using words or drawings. Make sure that each criterion is specific, for example if participants say ‘water’ clarity if they mean ‘access and availability of water’. Once all changes have been identified, ask participants to select the cards representing the changes which are most important to them. It is the facilitator’s job to ensure that the ones most important to the project are included. |
| Step 2 | Then ask participants to define a timescale for their analysis. It may be based on generations, such as ‘in our grandparents’ time’, ‘in our parents’ time’ and ‘in our time’, or other important activities, events, or years.
Ask the community helper to draw a matrix on the ground and show the chosen time scale on the horizontal axis along the top of the matrix and place the cards with the trend criteria identified in step 1 down the vertical axis (figure T11A-1). |
| Step 3 | Next, explain to the group that they will complete the matrix and decide with the group how they wish to display the situation for each trend criteria. For example, by scoring criteria that can be measured using seeds or stones (0 to 10 for income/expenditure), and/or drawings, symbols, or words for lists of objects etc. As the group defines the scenario for each trend criteria, ask the helper to represent the situation on cards using the chosen means of display. |
| Step 4 | Once the matrix is complete, record the trend analysis by adding a column labelled ‘analyses to the matrix.
Use the following guiding questions to facilitate a discussion about changes over time:
• What are the significant trends or changes that have occurred over time?
• Are these trends/changes positive or negative?
• What caused these trends/changes to occur?
In the ‘analysis’ column, write whether the change has been positive or negative and have participants expand on the negative changes. Explore the possibility and interest in taking action to address the identified negative changes. |
| Step 5 | The matrix produced should be left with the community. Take a picture or copy and add it to your project action tracker for future reference and to assist with intervention planning. |
Facilitator’s Notes: Changing trend analysis
- Include a broad cross-section of animal-owning household members of all ages. Invite 10-20 people to participate in this exercise (e.g. youth, adults, elders).
- If it is not possible or locally appropriate to do the exercise collectively with both sexes, conduct the exercise separately with men and women. Each may recall different events and changes due to the impacts that resulted in their lives.
- Do not lead participants into identifying changes that are not important to them. While asking probing questions, emphasize identifying changes that they perceive to be important. Events or perceived changes should not be included simply because the facilitator inquiries about them.
- Clarify any doubts to understand people’s perceptions about changes over time by reaching consensus amongst participants.
Next Steps
As part of a community needs assessment and shared vision, this activity might accompany one or more of the following tools to get a full picture of community dynamics and needs for project planning:
- T1 Mapping to understand which resources and services are important to the community.
- T2 Mobility Map to understand where people spend most of their time and how long it takes to get places.
- T3 Venn Diagram (T3b Social Networking Venn diagram) to identify key individuals, groups and actors perceived to be most important to people and their animals.
- T4 Daily Activity Schedule to understand which activities take up the most time.
- T6 Seasonal Calendar to identify periods of scarcity and risk for the community.
Once a needs assessment is complete, consider:
- T12 Dependency Analysis to understand animal-owning households’ level of dependency on external actors and their implications on resources and services important to ensuring animals’ welfare.
T11b: Before and Now Analysis Changing Trend
The before and now analysis helps the community to identify changes from the beginning to the end of an animal welfare improvement project. This tool may be used to analyse many different aspects of peoples’ lives and the lives of their animals, including changes in people’s reliance/use of animals, animal care practices, animal disease patterns and related impacts on people, availability and use of animal-related health services and resources, climate or other environmental factors affecting animals and people.
| Tool purpose: | Time needed: |
• To reflect on perceived changes in the lives of animals and animal owning households within the project period
• As a learning and reflection tool to assess perceived changes in animal welfare and people’s behaviours as a result of community/project activities
• To determine if there are remaining areas of improvement that can be addressed | 2 hours |
| Materials needed: |
| Cards, pens, markers, coloured powder, chalk, sticks, tree leaves, coloured cards or other locally available materials. |
Project Phase:
Exit & Evaluation Phase
Approaches for Working With Communities: Community Development Approach, Community Engagement Approach, Societal Outreach and Campaigns Approach
Behavioural Drivers (COM-B): Motivation
Stages of Behaviour Change: Maintenance Stage
Project Support: Participatory Learning and Action Tools, Monitoring and Evaluation
Specific Topics: Animal Husbandry and Management; Livelihoods; Vulnerability/Resilience
| Before and Now Analysis |
| Project Change Criteria | Before | Now | Score |
| Food Provision | Provided:
• Wheat straw
• Rice husk | Provided mixed feed:
• Wheat straw
• Wheat bran
• Gram
• Green fodder | 8 |
| Water Provision | Once during workday | 4 – 5 times during workday | 10 |
| LSP Skills | Farriers were unskilled and made mistakes | Farriers now more skilled and make less mistakes | 7 |
| Owners’ knowledge of AW | Owners lacked knowledge of how to recognize | Owners know what to look for when animals being treated by LSP | 7 |
| LSP access | Previously free services | Availability better – now have LSP phone numbers | 7 |
| Beating | Everyone used to beat their animals | No more beating | 6 |
Figure T11B Before and now results from a group of animal owners in Faisalabad, Pakistan
The matrix in figure 11B was produced by a group of animal-owners at the end of a five year project as part of the community’s self-evaluation. They wanted to determine whether the human and animal welfare changes within their community could be sustained over time without the intervention team. The group compared the situation before the intervention to the present state, analysed what the differences meant and whether they thought that they had the skills, knowledge and tools needed to continue to improve on their own.
The group identified six key areas where change has been observed since the beginning of the animal welfare improvement project: food provision (dietary diversity), water provision (daily increase), local service providers’ skills (improvement), owners’ knowledge of good animal welfare, access to local service providers (LSPs) and beating of animals. After scoring the extent to which the majority of the community had made positive change, the group determined that more work was needed to improve LSP skills, owners’ knowledge of animal welfare, access to LSPs and beating of animals. They added the actions that they would take to the community action plan and set a date for the next meeting to focus on beating, which scored the lowest amongst the positive changes.
| Before and Now Analysis |
|---|
| Step 1 | Start by explaining to the group that they will be reflecting on changes in the lives of animals and their own community members within the project period, comparing how things were before the project to now. |
| Step 2 | Ask the group about the present situation relating to animals’ care, use and their own livelihood status. Have the group compare the present situation to the past.
Ask:
• What are some of the changes that have resulted since project/community action plan activities were implemented?
• How have things changed since the beginning of the project?
As the community comes up with the present situation, have the community helper write the changes with words or symbols on cards.
Examples of change categories might include:
• Men’s/women’s work types
• Animals’ usage
• Household income, expenditure, credit (group formation)
• Land access & usage
• Animal and human diseases and treatments
• Community dynamics (more cohesion amongst group)
• Climate change situation (water/feed storage)
• Political situation (changes to laws, by-laws)
• Environmental change (infrastructure improvements, increased availability of resources)
Please note: If the community comes up with more than 10 changes, ask participants to select the cards representing the 8-10 changes which are most important to them. |
| Step 3 | Ask the community helper to draw a matrix on the ground or large sheet of chart paper. Label three columns ‘change in project’, ‘before’ and ‘now’. Have the helper place the cards representing the most important changes down the first column under ‘change in project’.
Then, facilitate a discussion on how the present situation has changed since the project started. The past and present situations will be defined by the community through this discussion. As each situation is defined for each of the changes, have the community helper write the results on cards and place the past scenario in the ‘before’ column and the present situation in the ‘now’ column. |
| Step 4 | Have the community helper add a fourth column and label it ‘score’. Ask the community to score out of 10 the proportion of the community who meets the ‘now’ criteria. For example, a score of 10 = everyone has changed; 0 = no change. |
| Step 5 | Once the matrix is complete, discuss the results of the activity with the group.
Follow the discussion by asking:
• Does everyone agree with the results? If yes, why? If no, why not?
• What needs to change for everyone to achieve the desired result?
- Can you achieve the desired results without our intervention?
- If yes, do you feel that you have skills, knowledge, and resources to continue without the intervention team?
If the group determines that not all the project objectives have been met and wish to continue with the project, have the community helper add any identified priorities to the community action plan for later discussion and further planning. |
| Step 6 | The matrix should be documented through photos or recreated on paper. Copies should be made and distributed to the group for their records, future reference and/or action planning. Add a copy to your project action tracker. |
Facilitator’s Notes: Before and now analysis
- If possible, invite 10-15 people to participate in this exercise.
- If it is not possible or locally appropriate to do the exercise collectively with both sexes, consider conducting the exercise separately with men and women. Each may recall different change criteria due to the impacts that resulted in their lives.
- Do not lead participants into identifying changes that are not important to them. While asking probing questions, emphasize identifying changes that they perceive to be important. Perceived changes should not be included simply because the facilitator inquiries about them.
- Have the community’s original shared vision available for reference during the final discussion.
Next Steps
If the community determines it is satisfied with the changes it has achieved:
- Consider using T28 Group Sustainability Mapping tool to help participants in planning to sustain their welfare improvements independently once support from the facilitating organization has ceased.
- The facilitating organization may use the qualitative before and now findings of project successes to support project reporting or future funding proposals.
- If participants indicate the project activities have not achieved the desired changes, update the community action plan and project action tracker with any new agreed actions. Re-evaluate persistent issues using any or all of the following tools:
Tool adapted from: Participatory Rural Appraisal Manual (Trend Analysis pg. 25)
Link to References Cited
QUICK LINKS
T12 Dependency analysis Resources and Services
Dependency analysis planning
T12 Facilitator's NOTES
T12 NEXT STEPS
This tool analyses the household’s dependency on internal actors e.g., household or community, and external actors for resources and services, such as water, feed and/or grazing land, shelter, financial resources, equipment for working animals (e.g., harnesses, carts), grooming supplies, and services, such as animal health service providers. This exercise may also be adapted to assess dependency in contexts where key stakeholders are comprised of only a single group (e.g., women only).
| Tool purpose: | Time needed: |
• To increase community awareness of their dependencies on external resources and service provision actors and potential implications for promoting animal welfare.
• To motivate participants to take action to reduce unnecessary dependency on external actors and improve their self-sufficiency. Activity discussions can motivate collective action and group formation.
• To identify project support required to support animal-owning communities in reducing their dependency on external actors.
• To monitor changes in reduced dependency on external actors and improvements in self-reliance, which can serve as a proxy indicator of improved resilience/reducing community vulnerability to vulnerable | 2-3 hours |
| Materials needed: |
| Chalk, coloured dust, stick, stones, pebbles, cards or paper, pens and any other locally available resources to represent service or resources. |
Project Phase:
Planning Phase, Implementation Phase, Exit & Evaluation Phase
Approaches for Working With Communities:
Community Development Approach
Behavioural Drivers (COM-B):
Behaviour Change Diagnosis and Planning, Opportunity, Motivation
Project Support:
Participatory Learning and Action Tools, Needs Assessment, Monitoring and Evaluation
Specific Topics:
Animal Health and Services, Vulnerability / Resilience, Group Formation / Strengthening
Dependency Analysis
An animal-owning community used this activity to explore their dependency on external actors.
Figure T12a Dependency analysis – blank template
Figure T12b Dependency analysis produced by an animal-owning community
The group identified twelve resource and service providers on whom they felt they had an external dependency. After scoring their level of dependency, they discussed the reasons for the dependencies:
Figure T12c Dependency analysis – reasons for external dependencies and challenges
The group identified opportunities for action to improve animal welfare:
- The community requested support to learn how to make first aid kits for their animals, so they could stock basic medicines for treatment in their own village.
- Women decided to use their collective savings from their self-help group to purchase a grinder to begin making their own grain and thereby decreasing their cost of animal feed.
Through these actions, the group was able to reduce their vulnerability and improve their self-sufficiency.
| Dependency Analysis |
|---|
| Planning phase – Community action planning |
| Step 1 | Start by asking the group to think of all the resources and services they use to care for their animals and have the helper write them down. |
| Step 2 | Ask the community helper to draw a large table, either on the ground or on chart paper. There should be three main columns: ‘Resources & services’, ‘external dependency’ and ‘household/internal’ (See figure T12a). |
| Step 3 | Start analysing external dependency versus household/internal control, by asking the question: do you depend on an outside source to be able to provide this resource or service to your animal? Provide examples as necessary, such as shopkeepers to buy equipment and materials, feed/fodder sellers to buy feed/fodder, farriers to trim hooves. Have the group score the listed resources and services using seeds or pebbles out of a total score of 10.
Please note: If a household needed veterinary treatment for an injured animal, the external control might be scored as 6/10, as they are dependent on the veterinarian to provide treatment. If they do not rely on anyone externally (e.g. they produce all the feed & fodder themselves), the external score is 0 and the household/internal score is 10. |
| Step 4 | Ask participants to analyse their dependency on external actors based on the chart they have produced. Ask the community helper to record the responses or note them yourself. The following questions may be used to guide the discussion:
• Why do you depend on external actors for certain resources or services? (If not already identified through the exercise)
- If externally dependent actors have not already been identified through discussions, ask participants to identify them.
• How can you improve animal welfare by reducing your dependency on external actors?
• Are there collective actions that the community could take to reduce external dependency? |
| Step 5 | After this discussion, ask participants what actions they can take towards making these changes. Help the group to qualify short-term (~3 months) versus long-term actions (more than a year). If there is a long list of issues and associated actions, have the group prioritise just one or two to focus on before the next meeting.
Have the helper record the actions and linked activities in the community action plan. Make sure to include who will monitor it and a realistic timeline. Support the community by linking them to any necessary stakeholders. |
| Implementation phase - Participatory monitoring |
| Step 6 | Repeat steps 1-3 (above) to assess the changes agreed by the community in step 4 within the community action plan, by comparing with the previous activity outputs (step 5).
Initiate a final discussion using the following questions as guidance:
• Why have changes occurred or not? What are the reasons for changes?
• How have changes impacted on animal welfare and their own lives?
Comparing the past results to present situation can generate useful discussion about perceived improvements in animal welfare and related benefits to people’s livelihoods and well-being that have resulted from changes. |
Facilitation Notes
- Decide the group dynamics ahead of time and whether it would be best carried out with men and women (or other subgroups) separately or in a mixed group. This will depend on your rapport with the community, culture and local gender dynamics.
- If conducted separately between men and women, consider bringing the two groups back together at the end of the activity to review the results of each chart and resolve any discrepancies if time allows.
- An in-depth analysis of dependency on external actors (step 4) can take considerable time, so discuss this in advance with the group in preparation.
Next Steps
- Record the community’s short and long-term actions and related activities to your project action tracker. Revisit the activities in the next meeting to monitor their progress and what further support is required.
- T10 Gender Control Analysis is a useful tool for exploring the differences in internal control (within the household) between men and women.
- T13 Income, Expenditure and Credit Analysis is a useful follow-up tool for analyzing dependency on external actors for financial resources and motivating participants to take collective action to reduce expenditures or increase access to savings and credit through the formation of self-help groups.
Tool adapted from: Flora & Fauna, Resource Access and Control (2013)
Link to References Cited